The complete Power BI design system for Figma. Design modern dashboards faster using 7,800+ components, design tokens, KPI widgets, responsive layouts, and built-in light and dark themes.
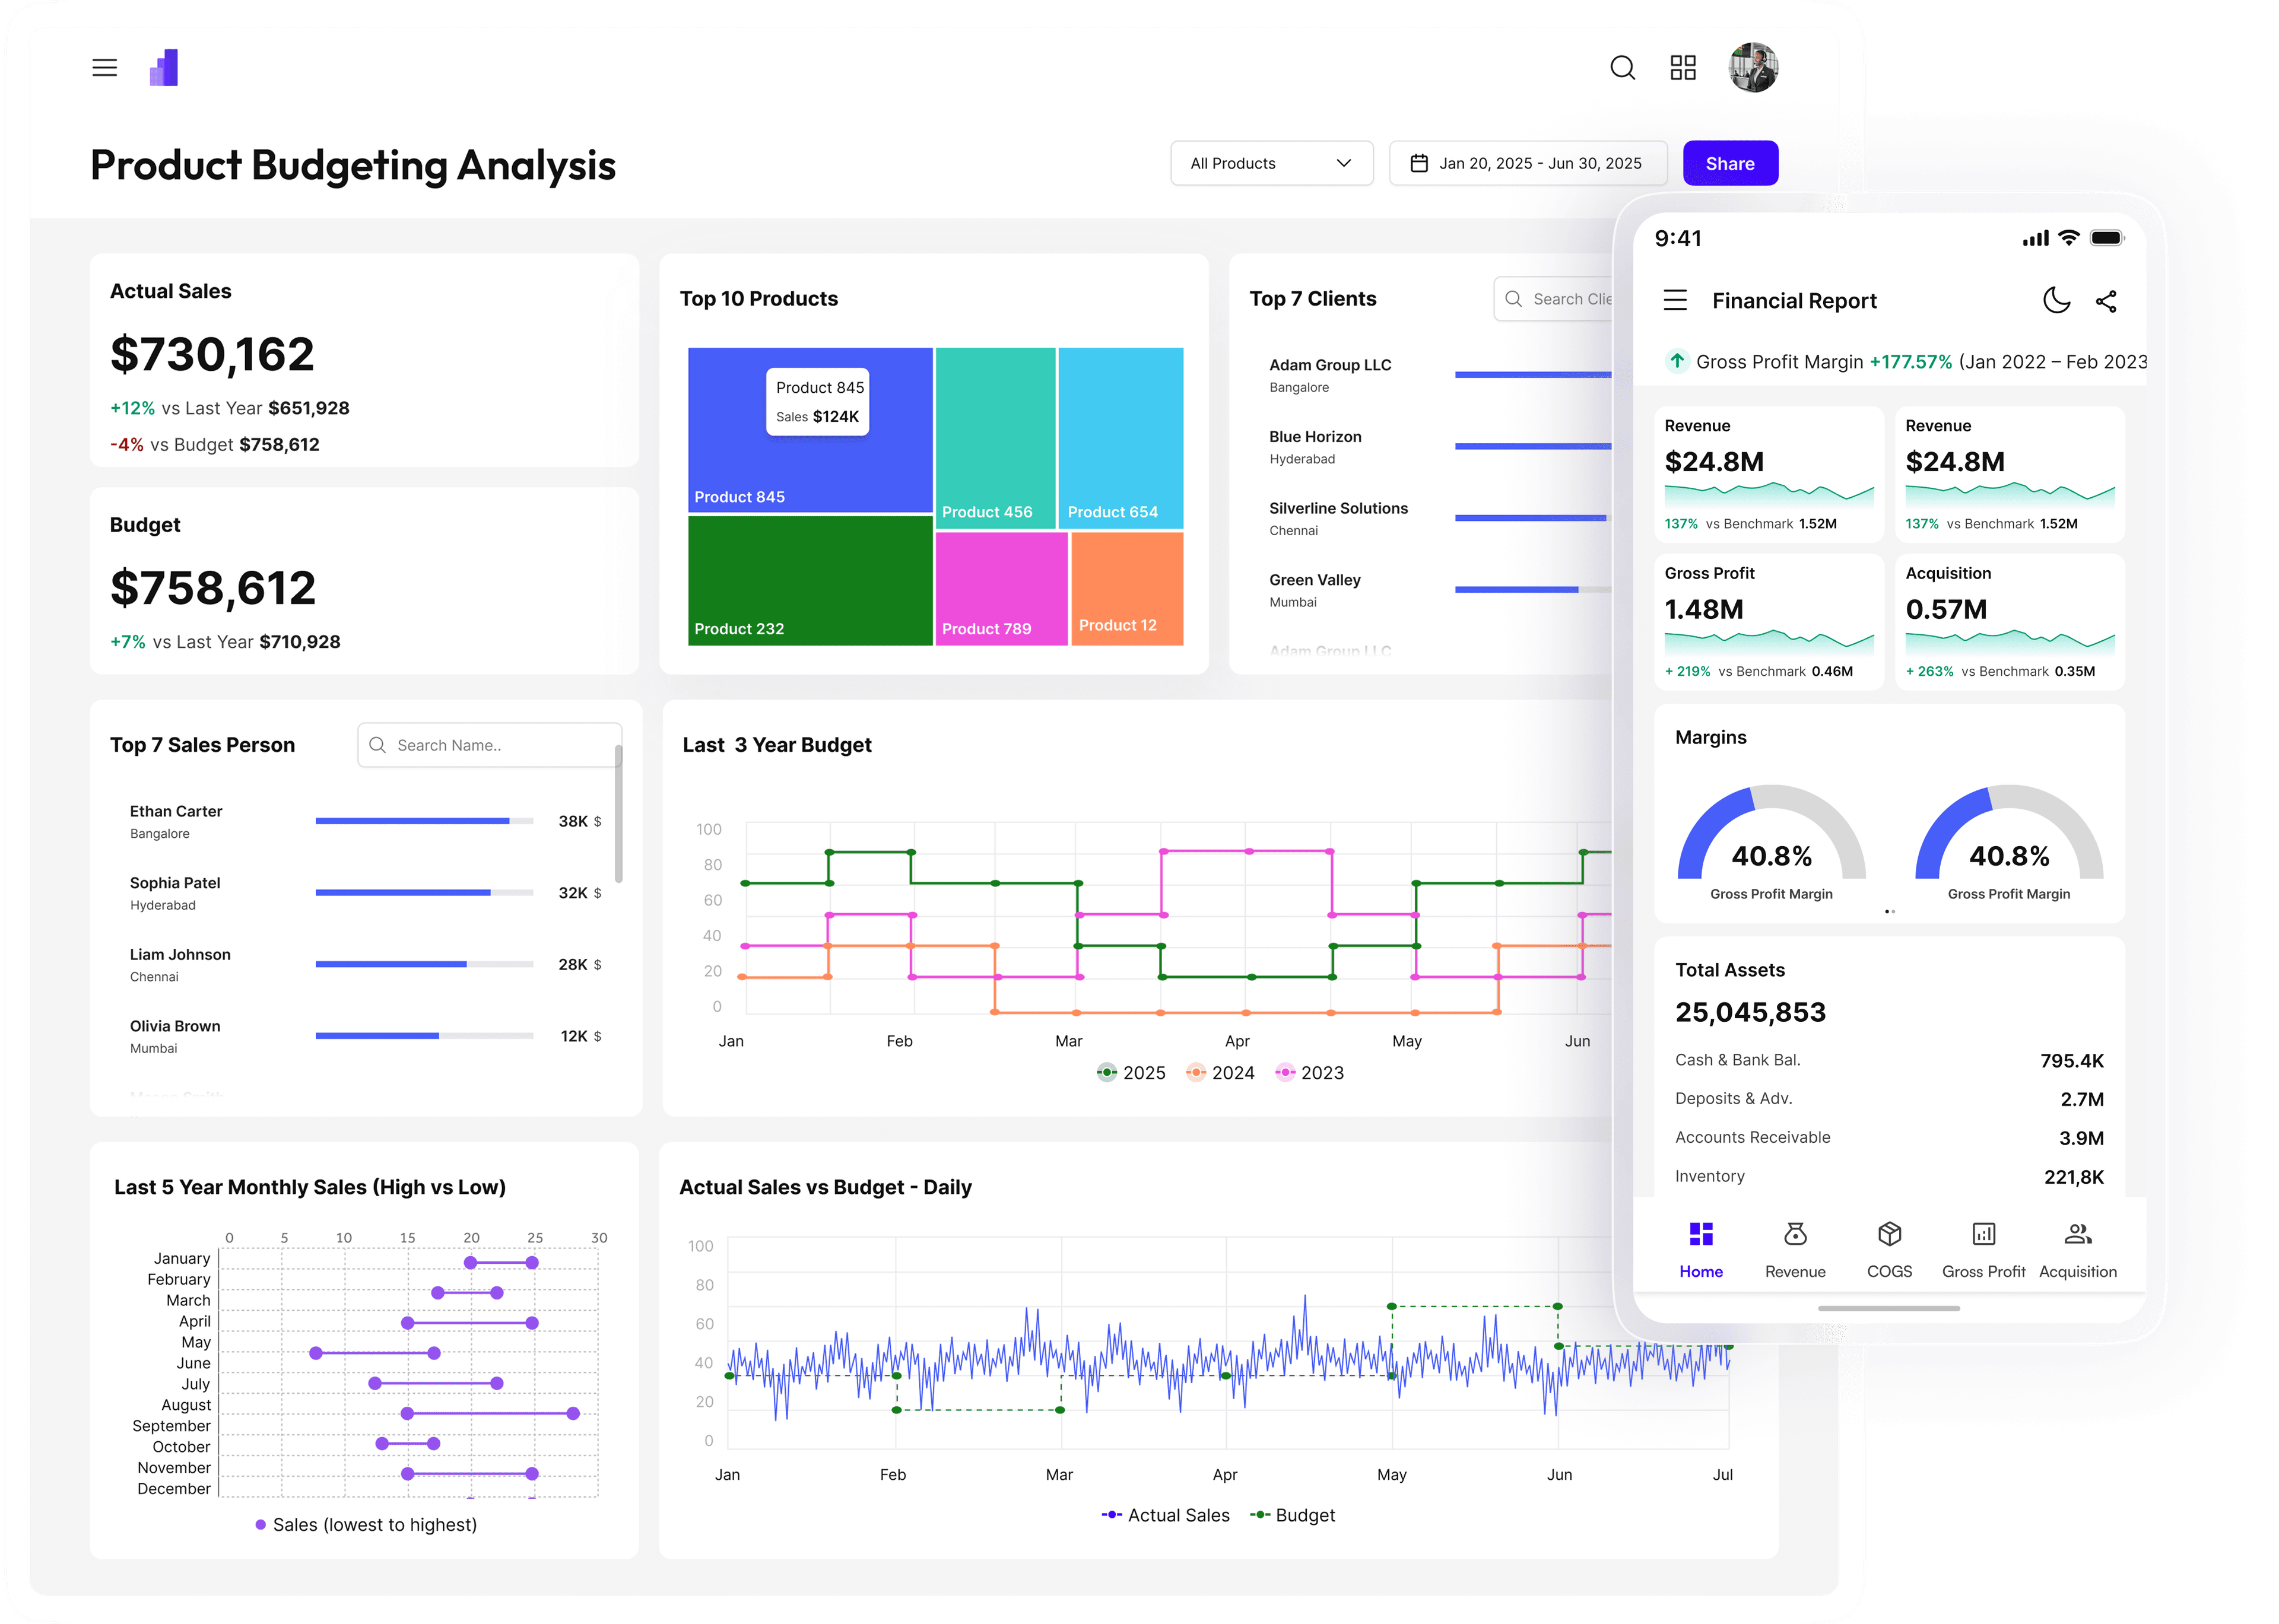
Professionally designed dashboard components built specifically for Power BI dashboards and analytics applications.

Styles, Variable & Tokens

Components & Variant

Examples Graphs & Charts

Figma Dashboard Layouts
Preview the Figma file, then watch a walkthrough on YouTube when you want the full pass.
We do not publish fake logos. These are the jobs the files are built for. If you have used them on a client project, send a two-sentence quote and we will add your name.
Show a Figma mockup in the kickoff, then deliver the PBIX instead of designing in Desktop from a blank canvas.
Keep HR, sales, and finance reports in one visual system across clients without rebuilding KPI cards each time.
Start from a finished industry file, swap the sample model, and publish a report that already has light and dark themes.
Professionally designed dashboard components built specifically for Power BI dashboards and analytics applications.
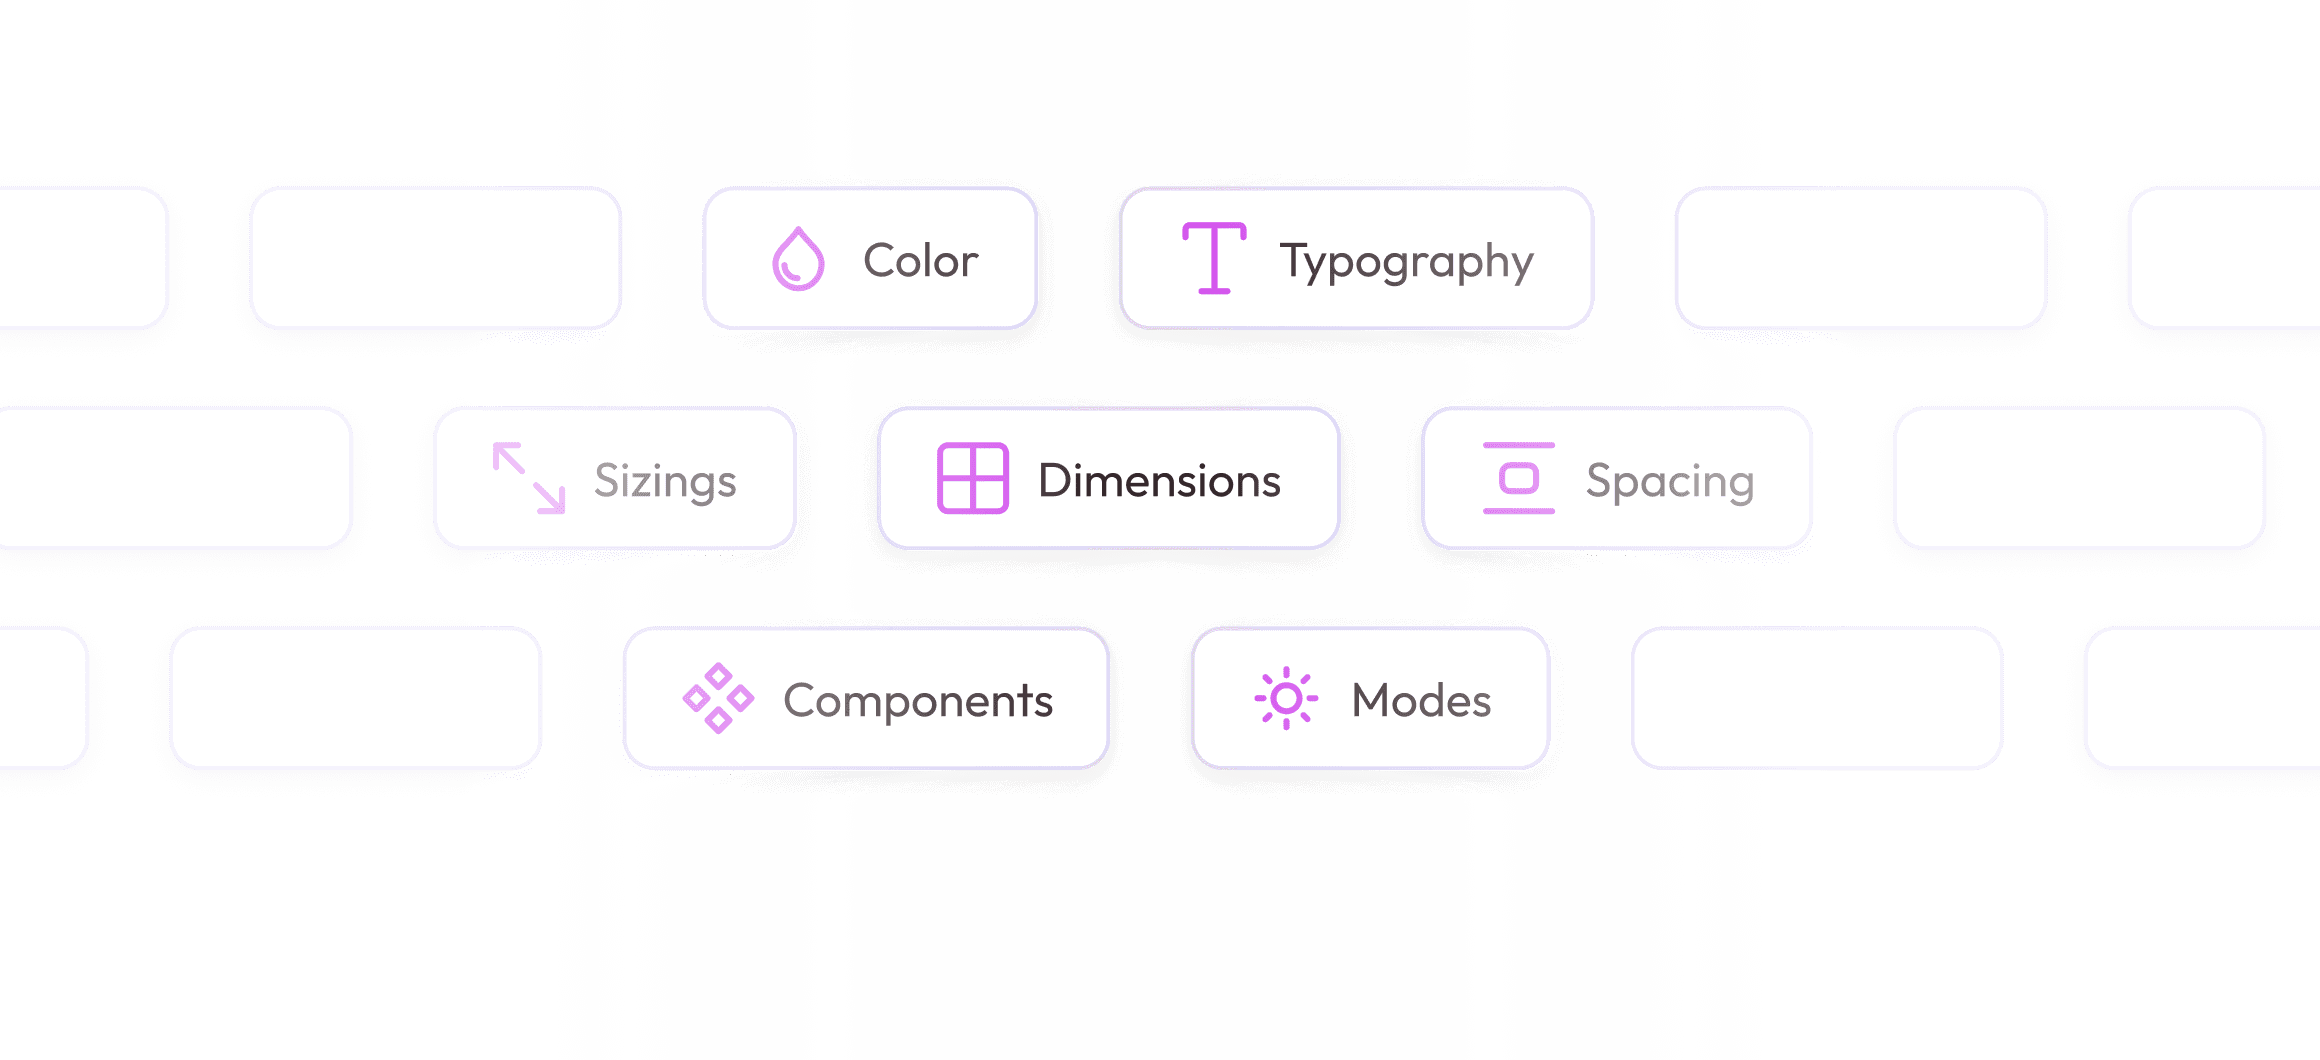
Manage colors, typography, spacing, radii, shadows, and themes using scalable design tokens built for Power BI dashboard systems.
Pre-built dashboard layouts, KPI screens, executive reporting views, and analytics page structures ready for customization.
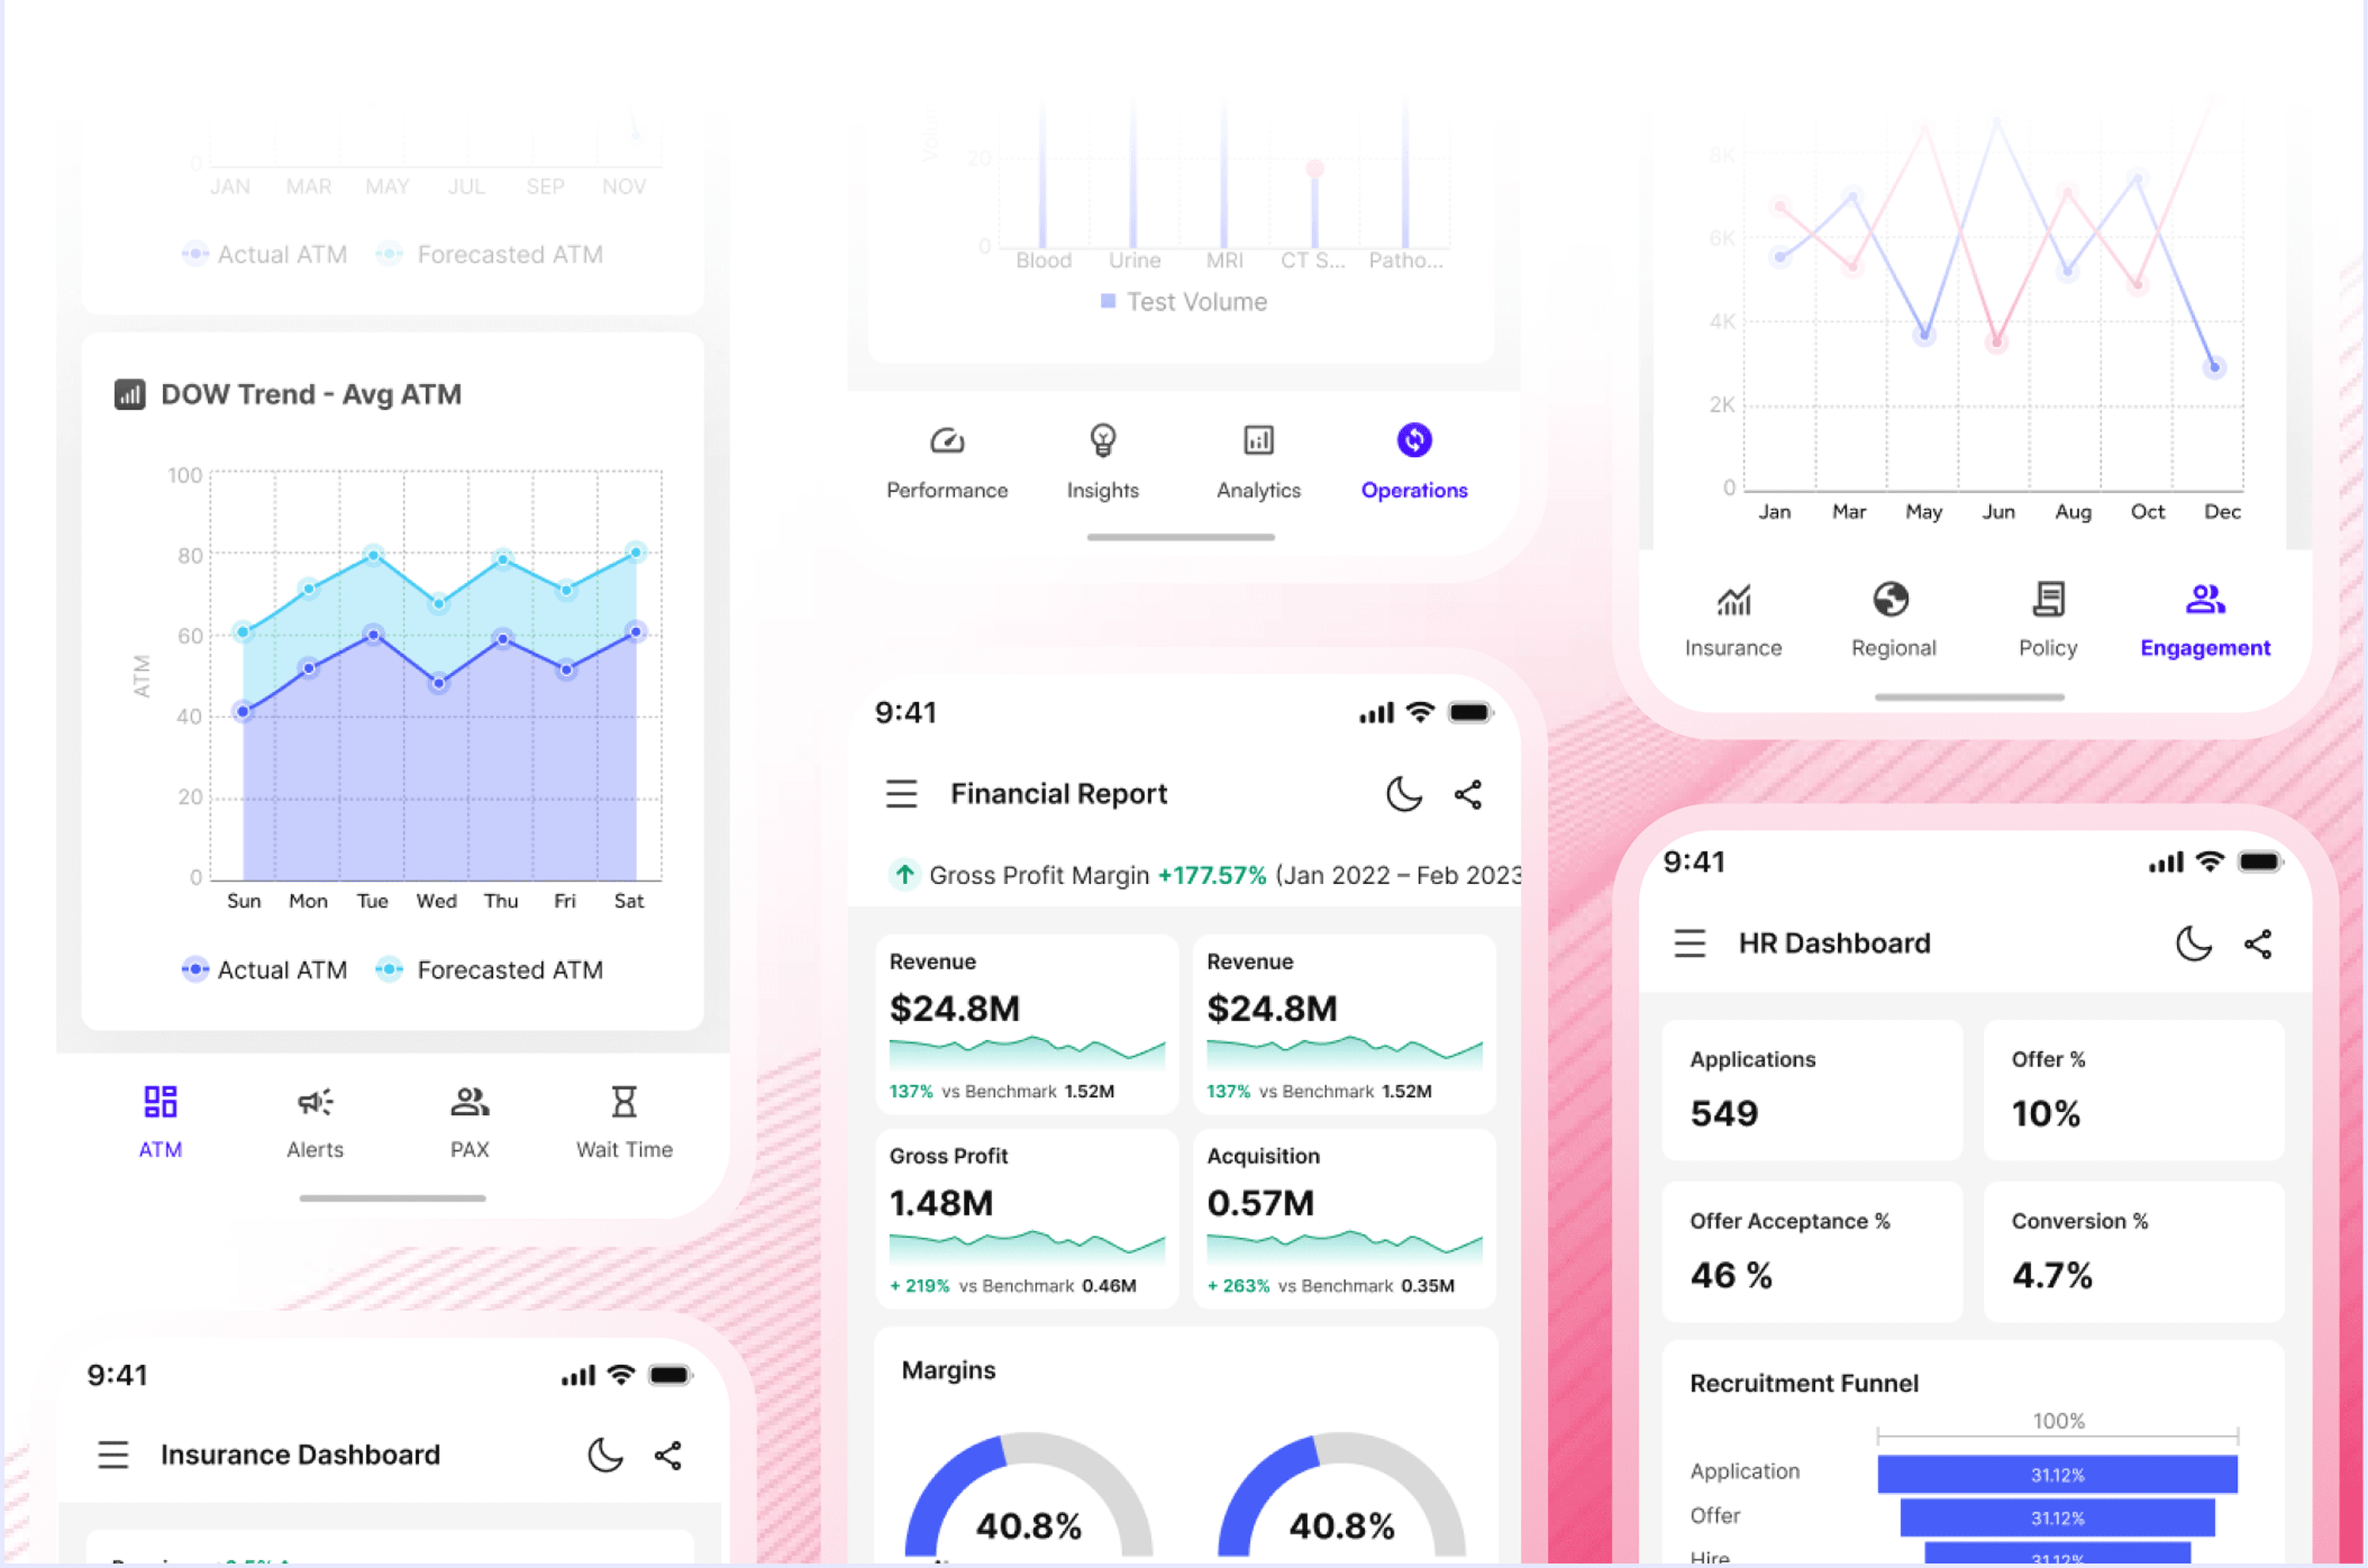
Adapt dashboards to any brand using customizable color systems, chart styles, typography, and theme controls.
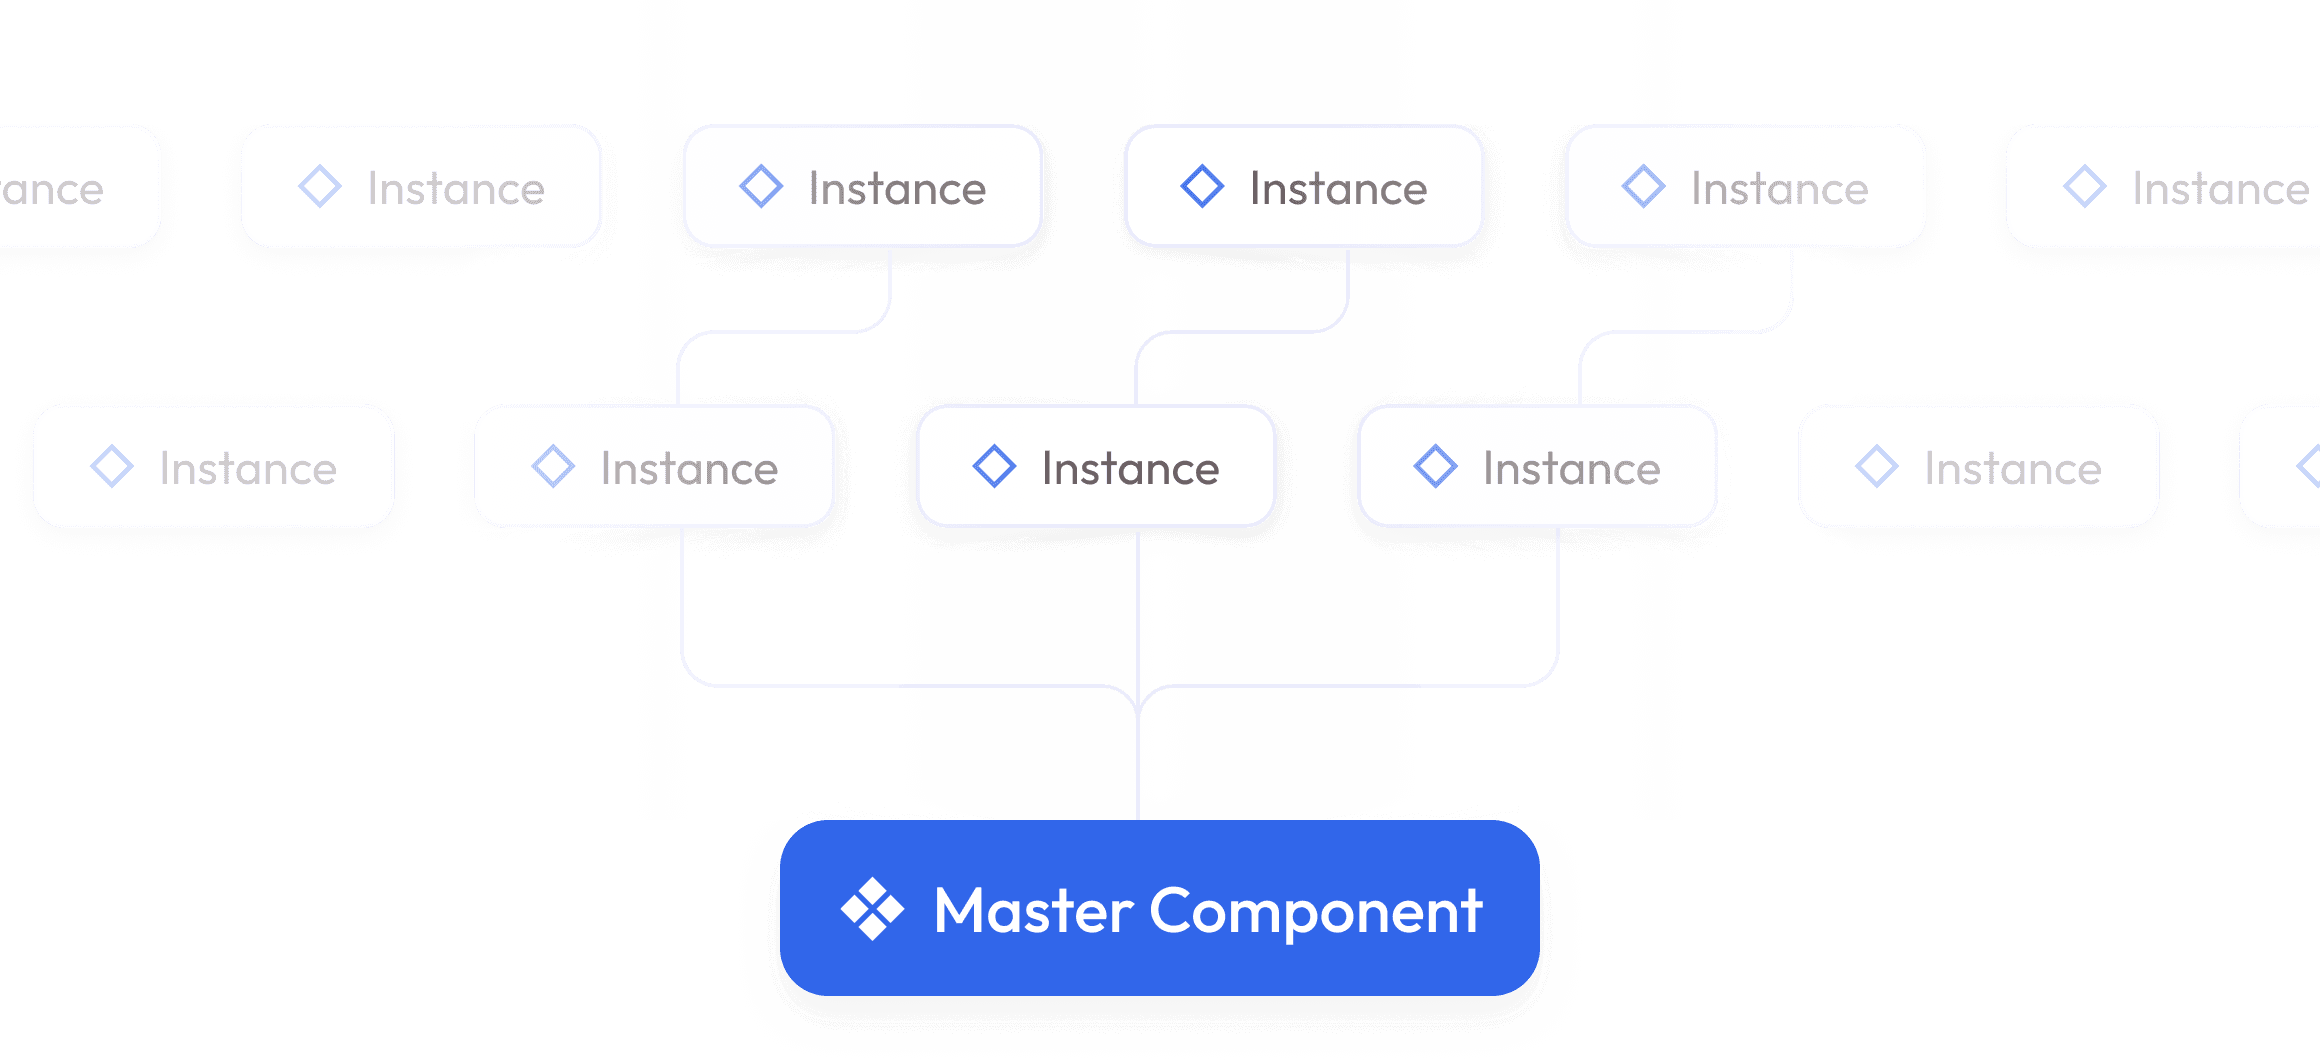
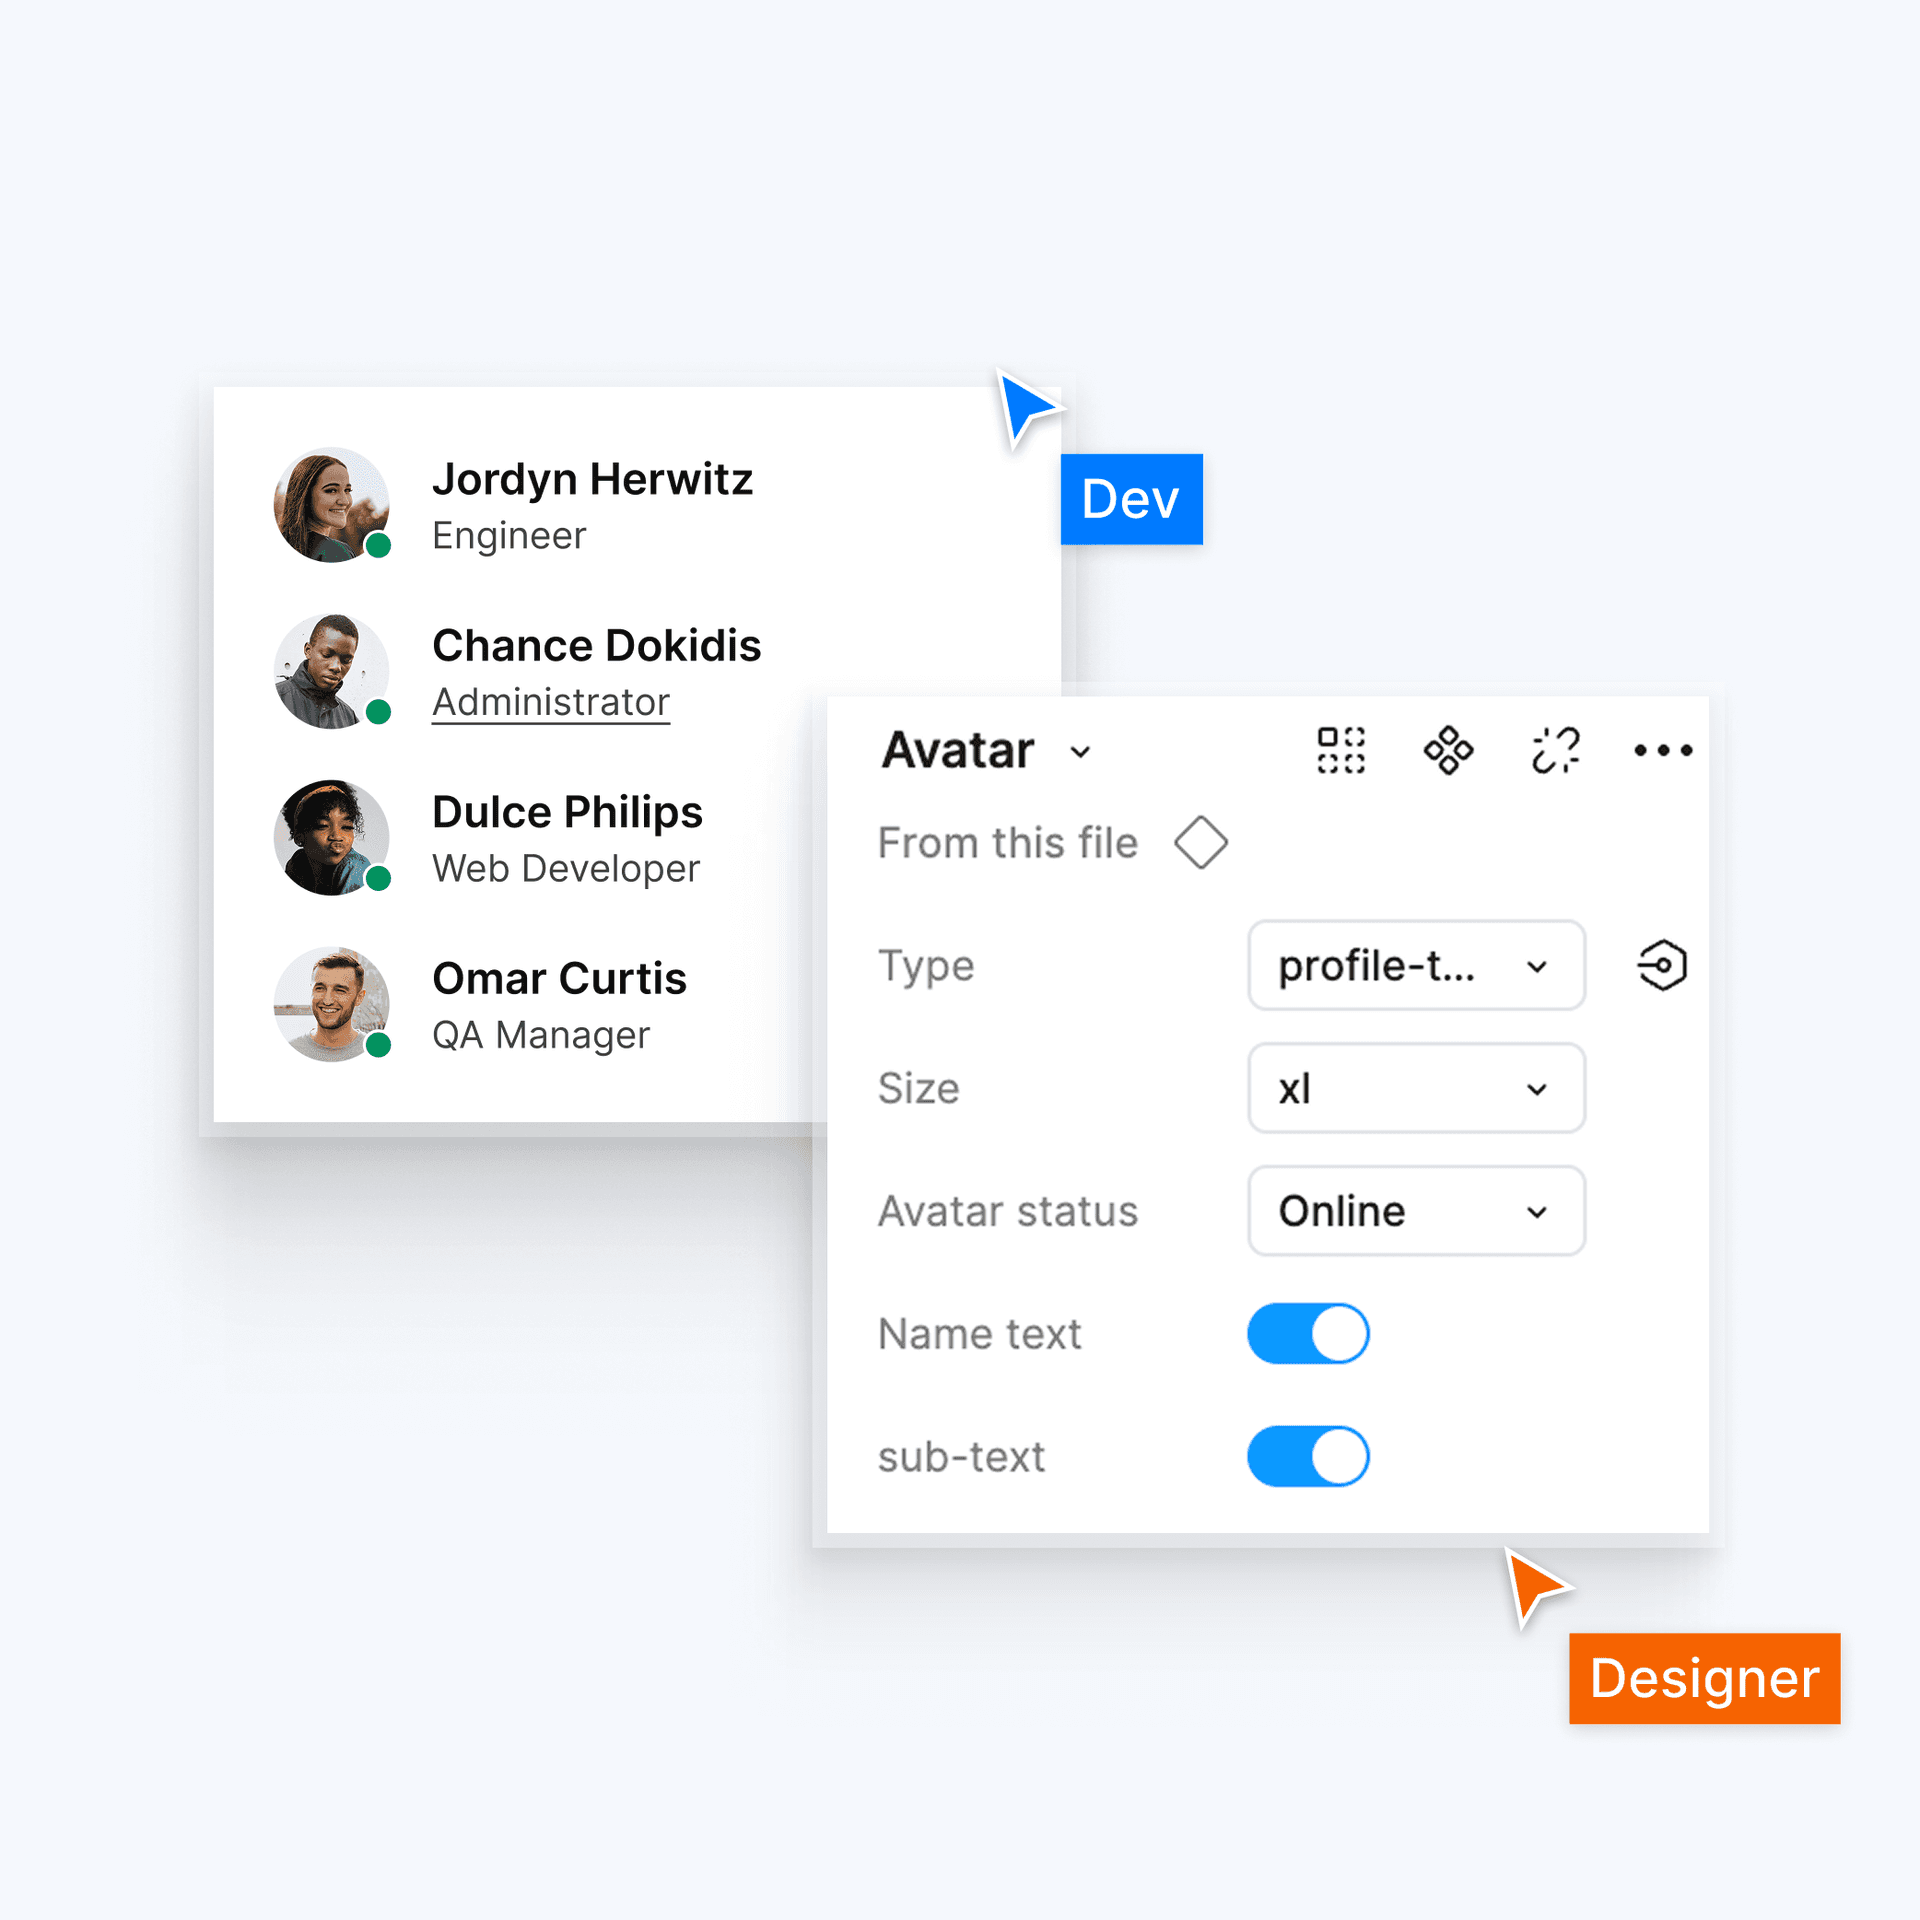
Create scalable dashboard experiences using reusable components, variants, and master design patterns.
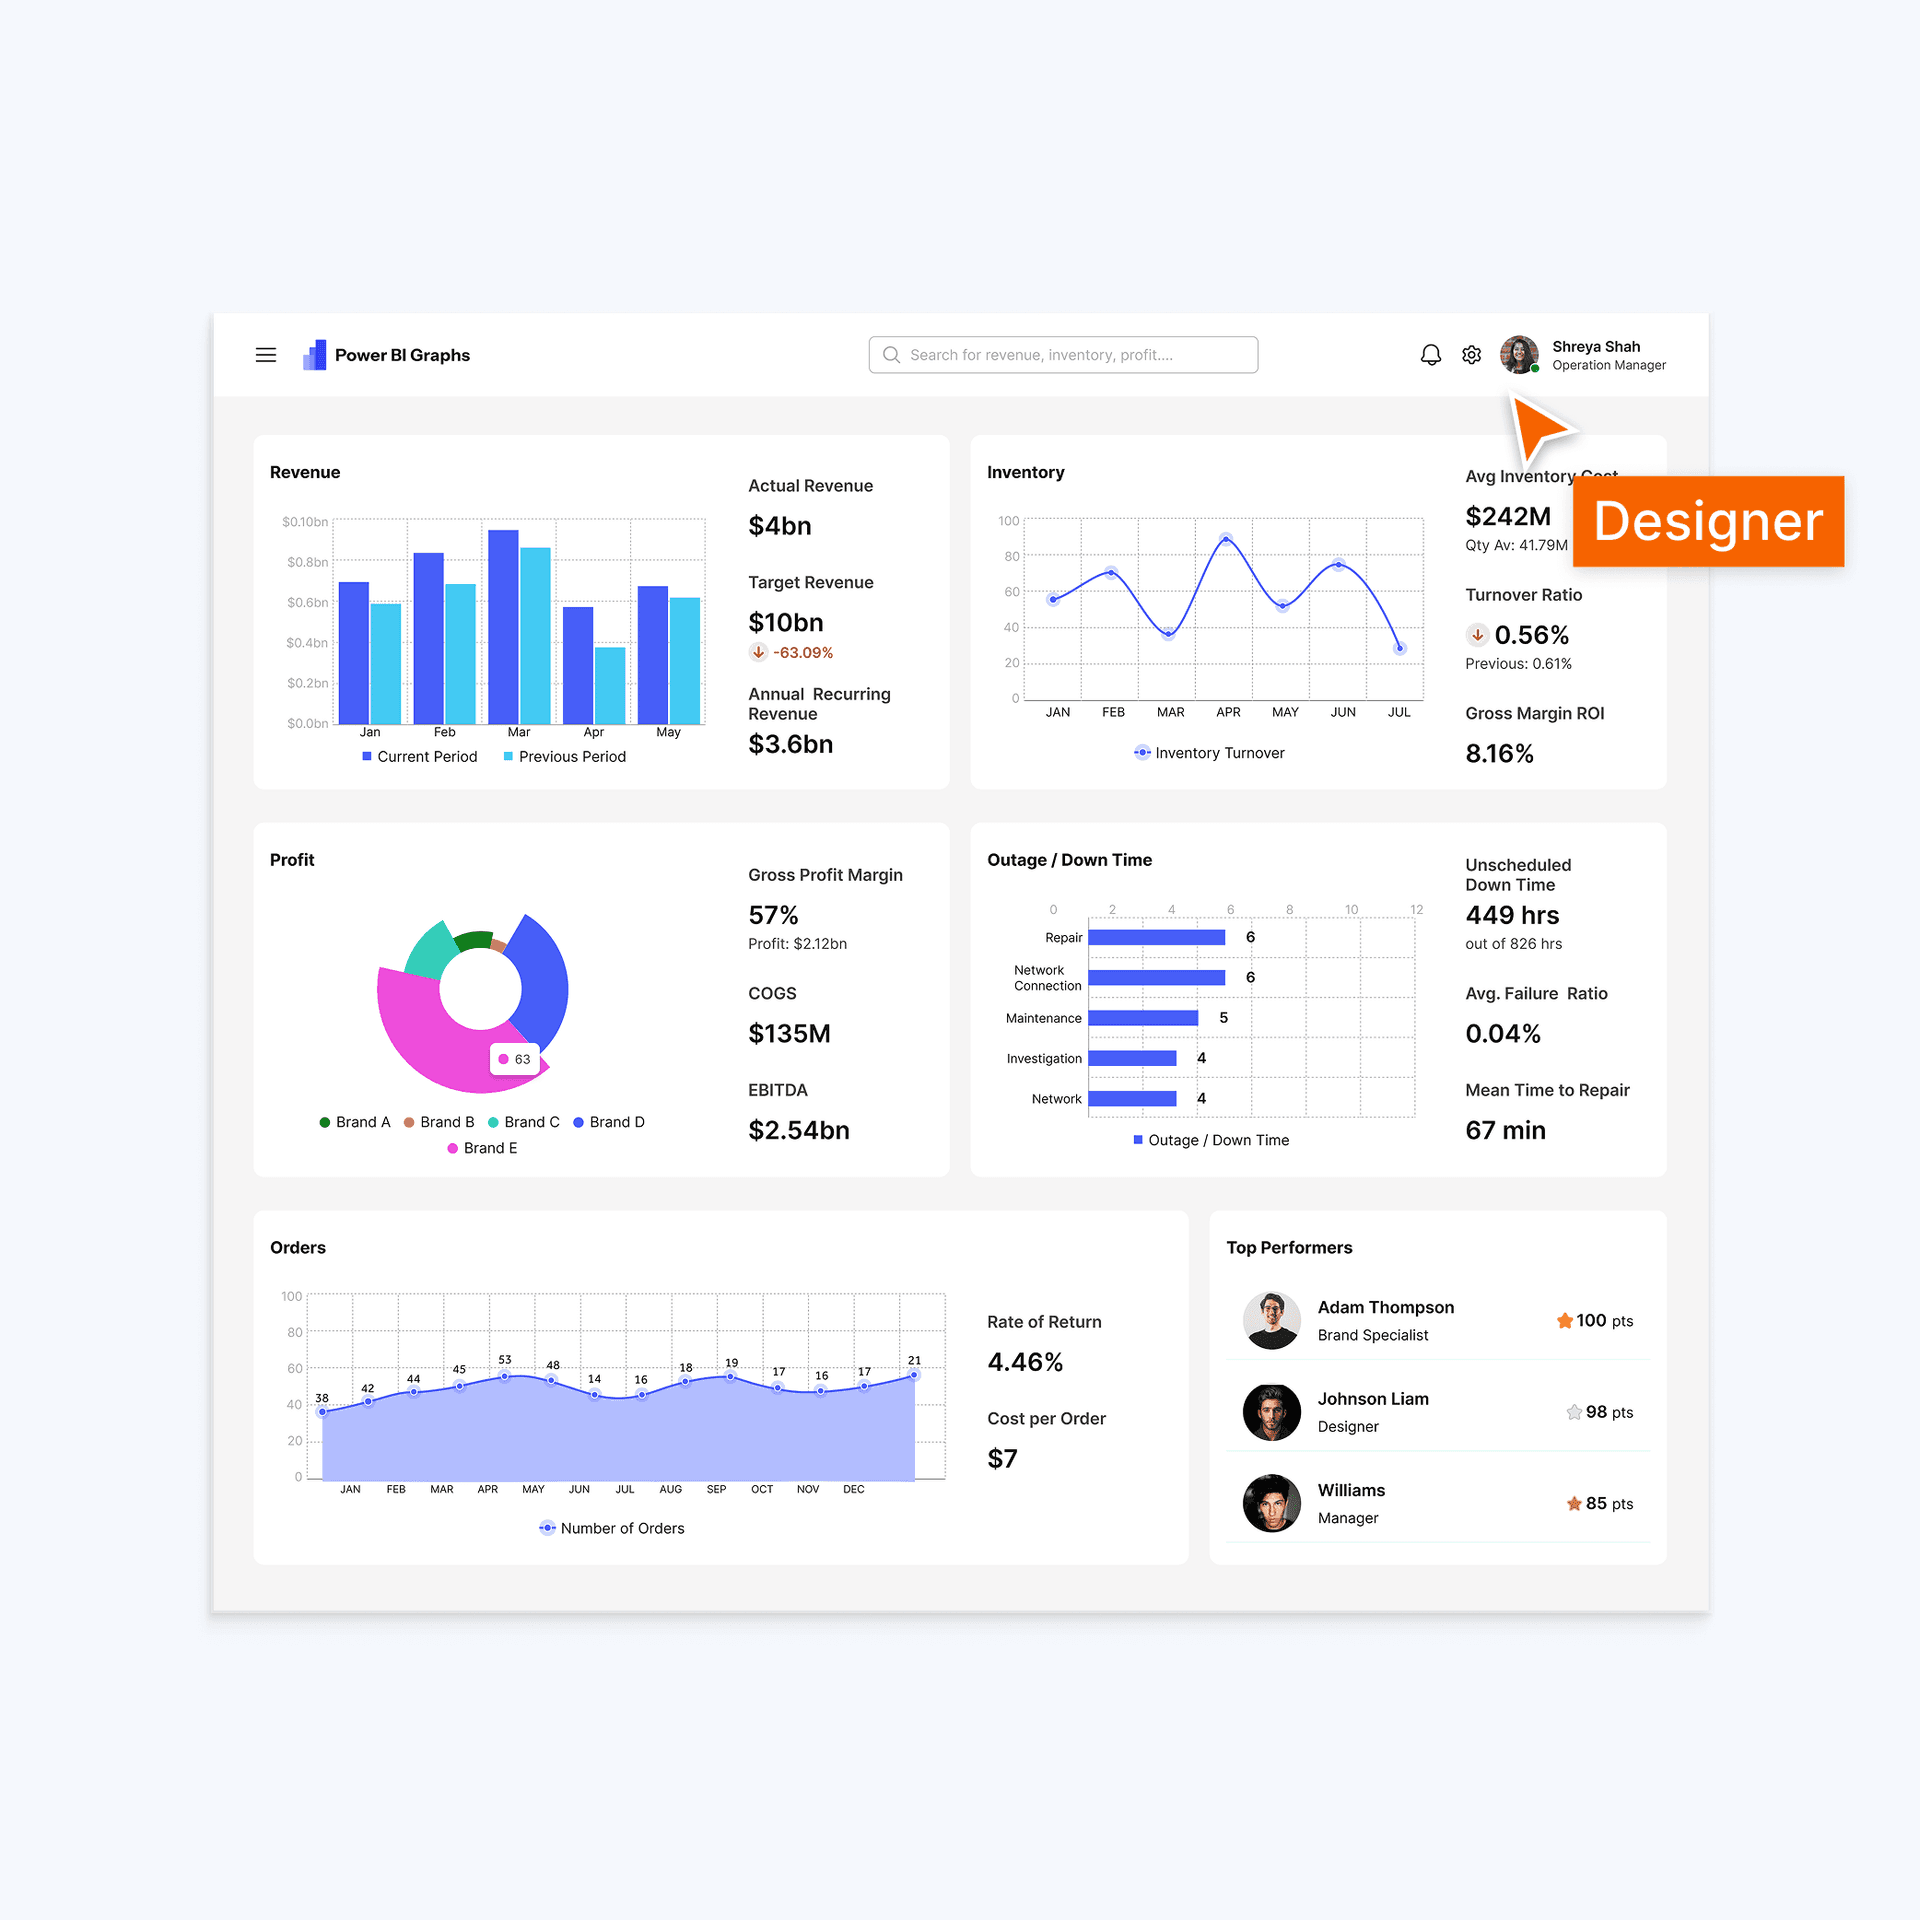
Track performance, business metrics, financial KPIs, and operational insights using reusable dashboard widgets.
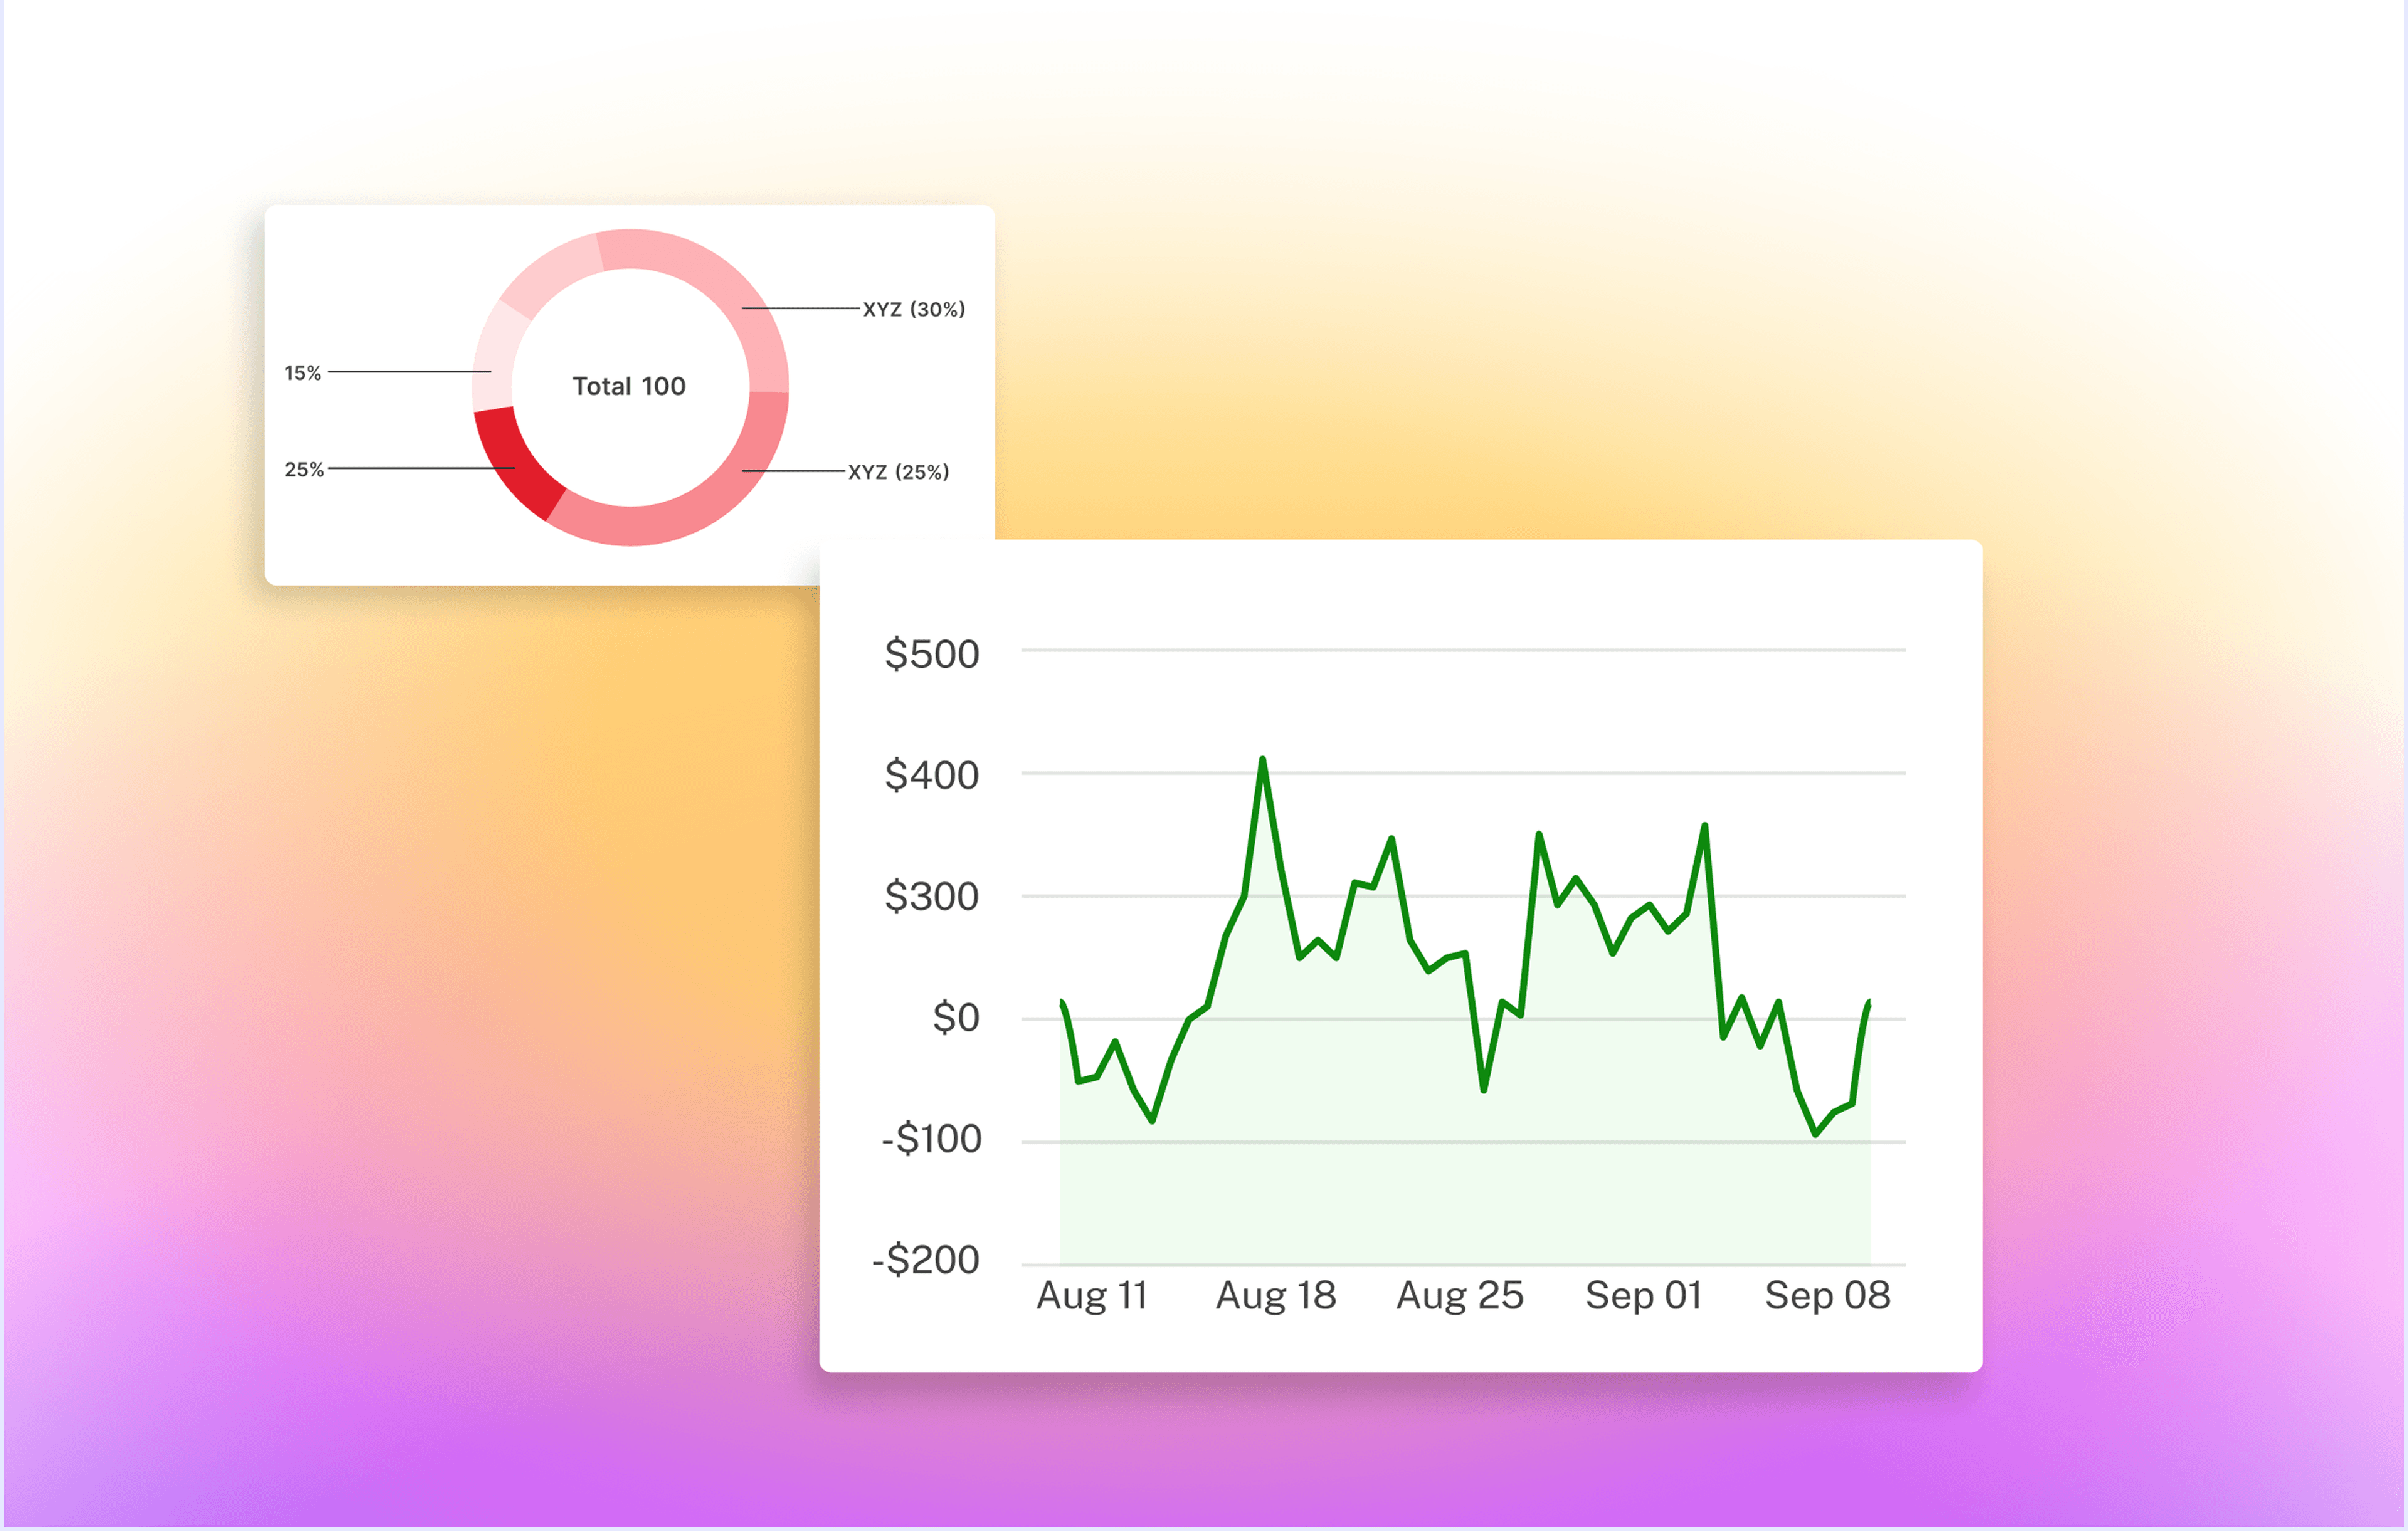
Design analytical experiences using bar charts, line charts, area charts, pie charts, KPI cards, tables, and data visualizations.
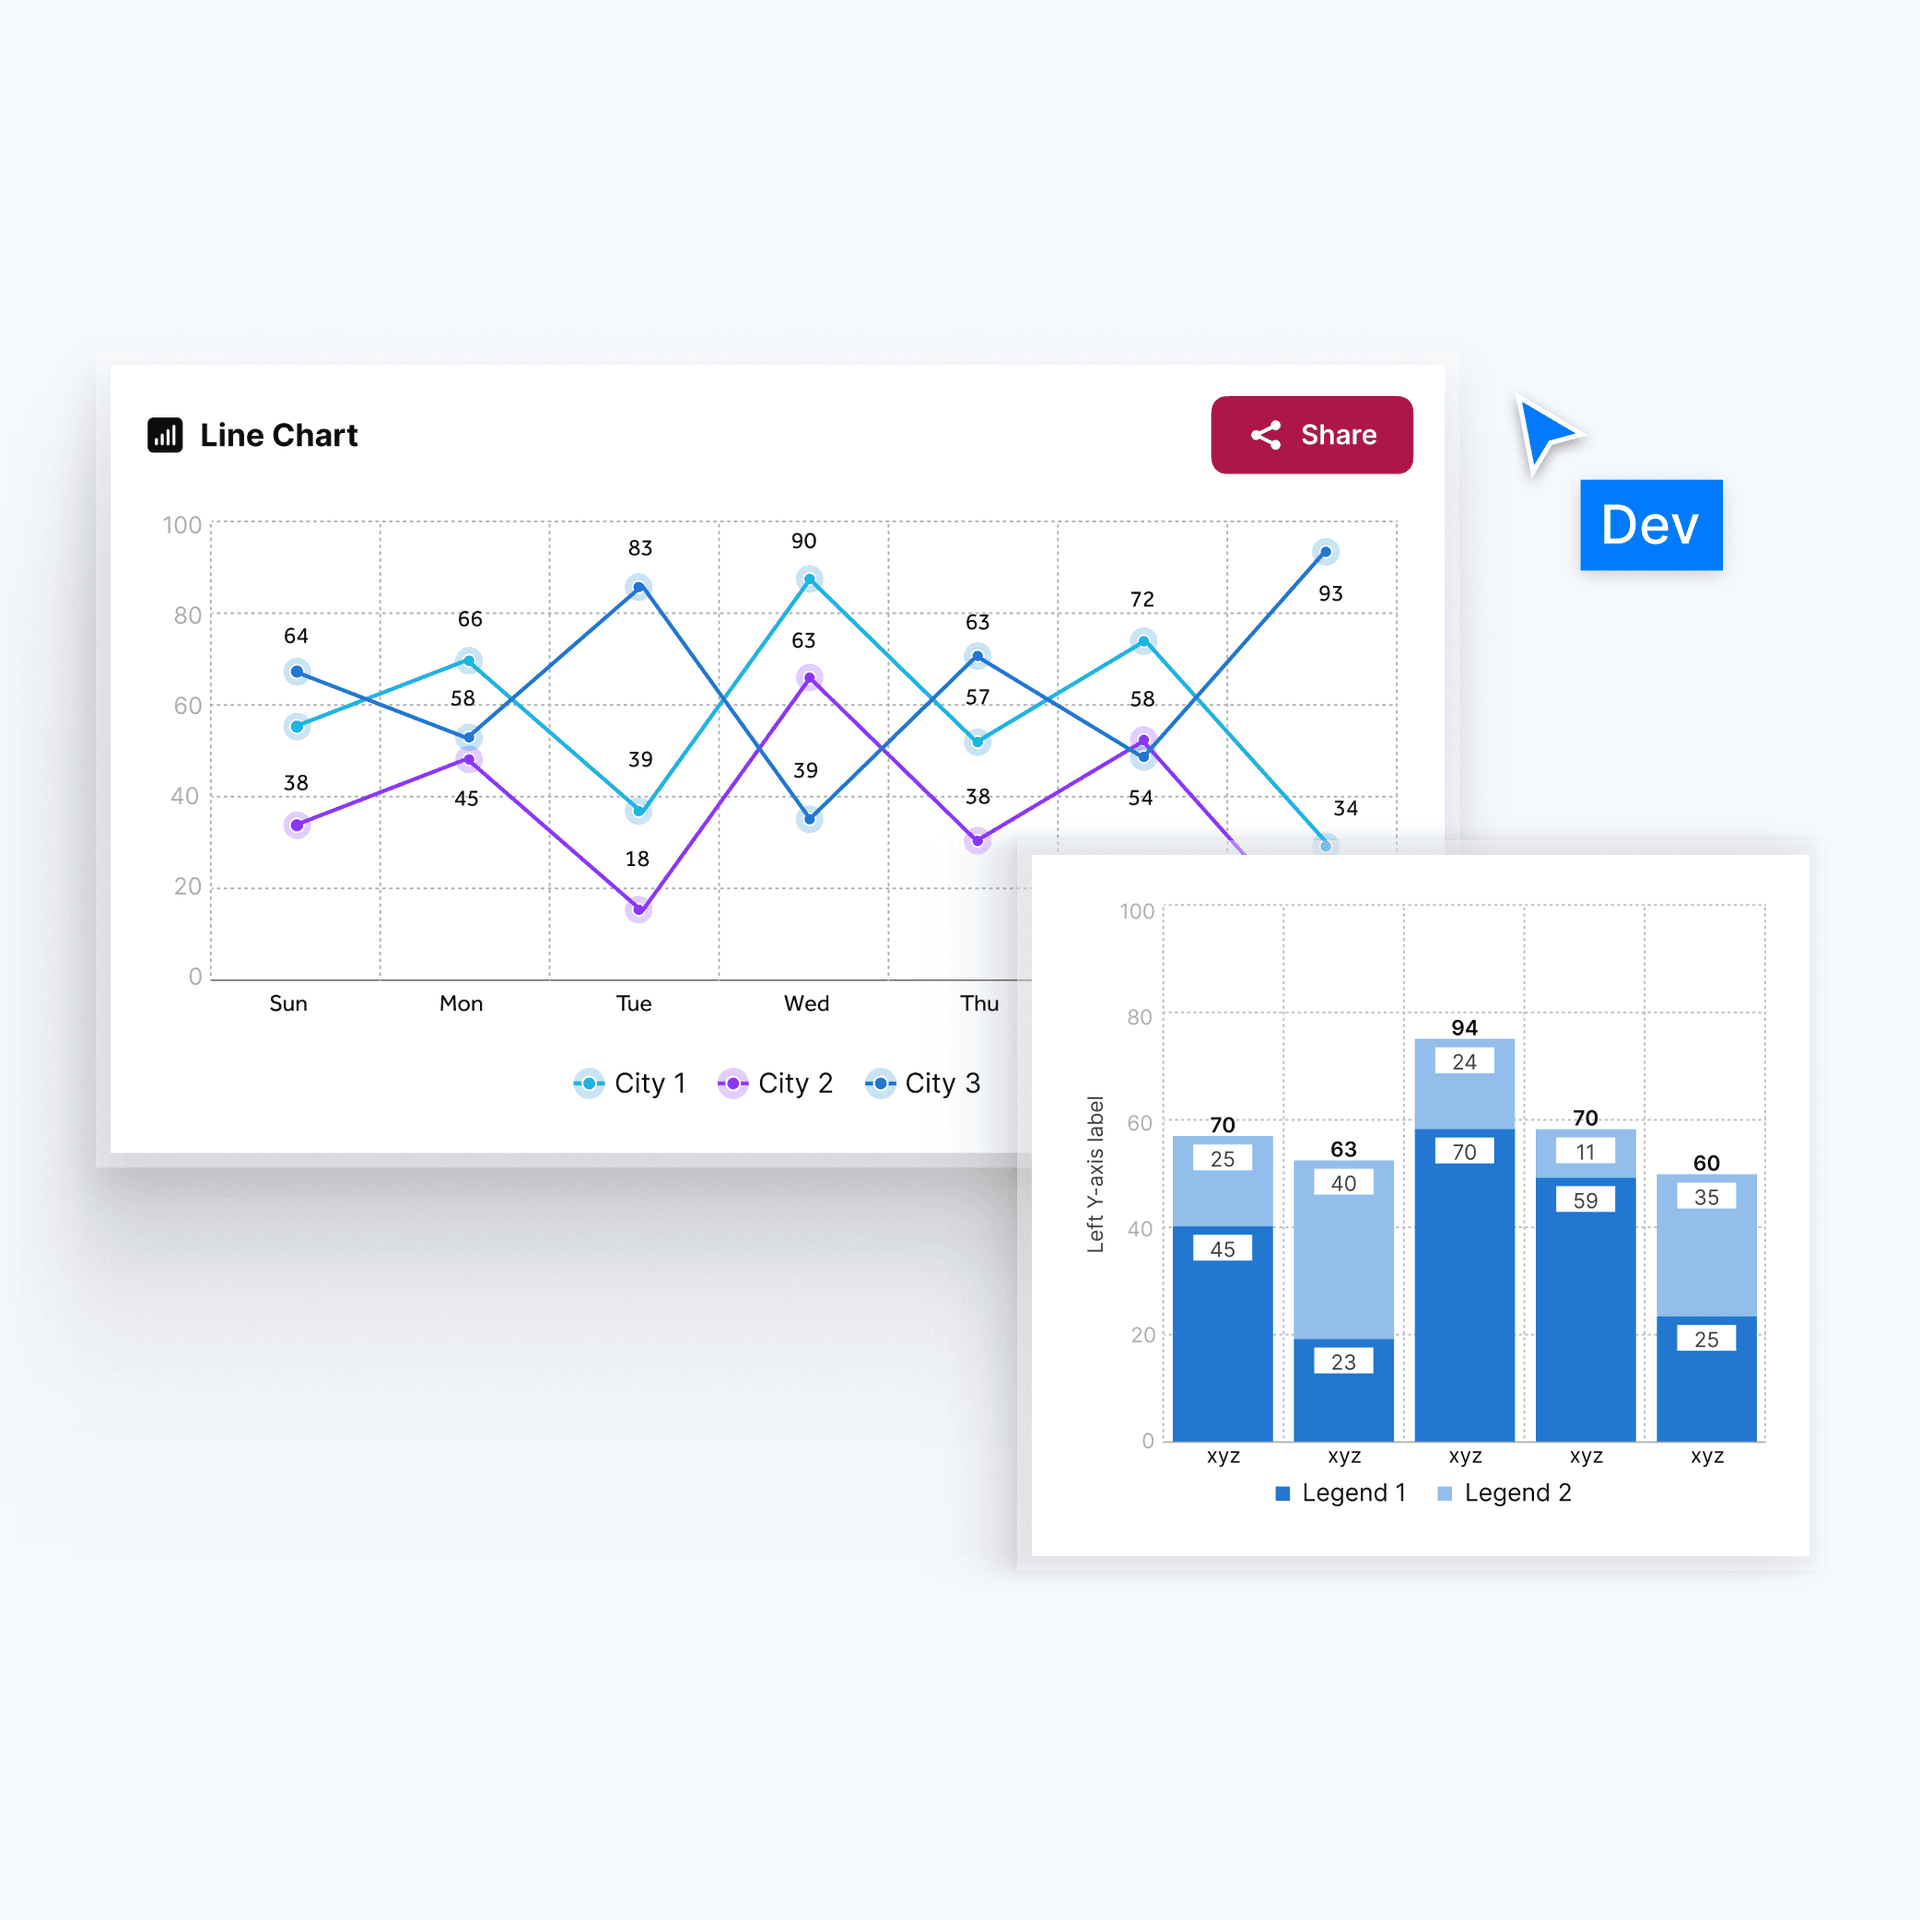
Create professional reporting interfaces with responsive tables, filters, sorting controls, and dashboard layouts.
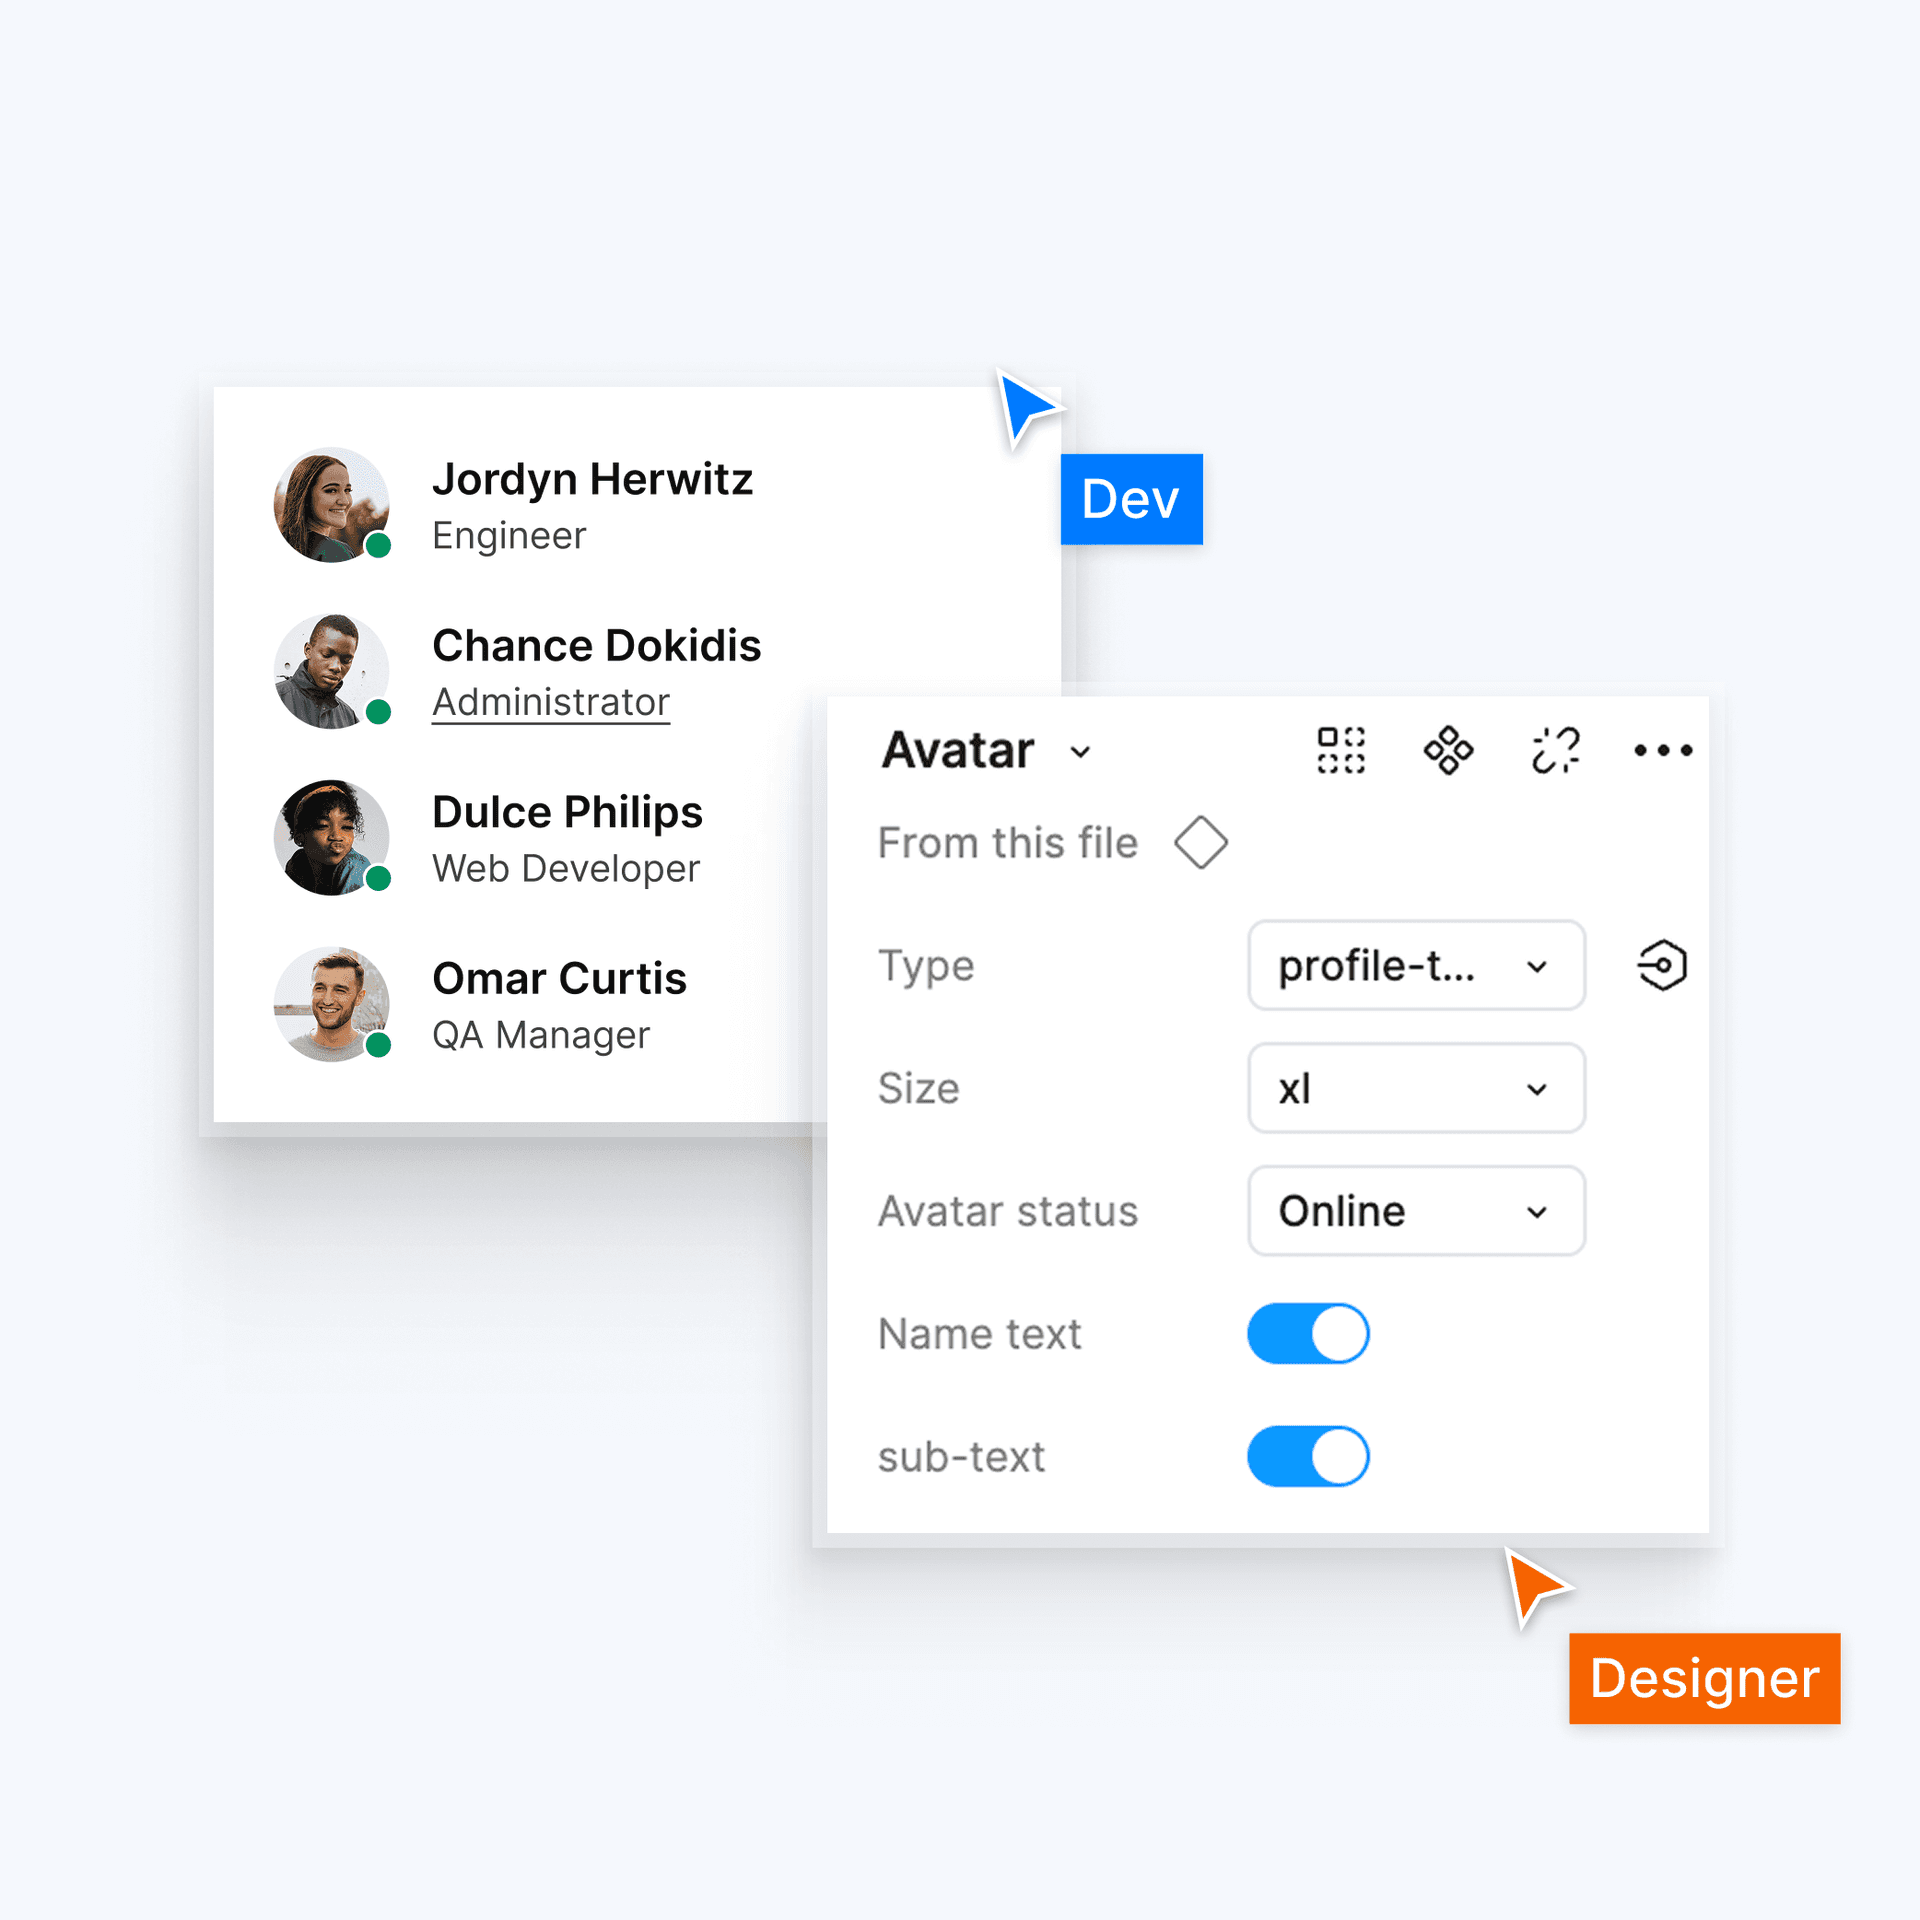
Maintain consistency across projects using reusable dashboard components, variables, and design tokens.
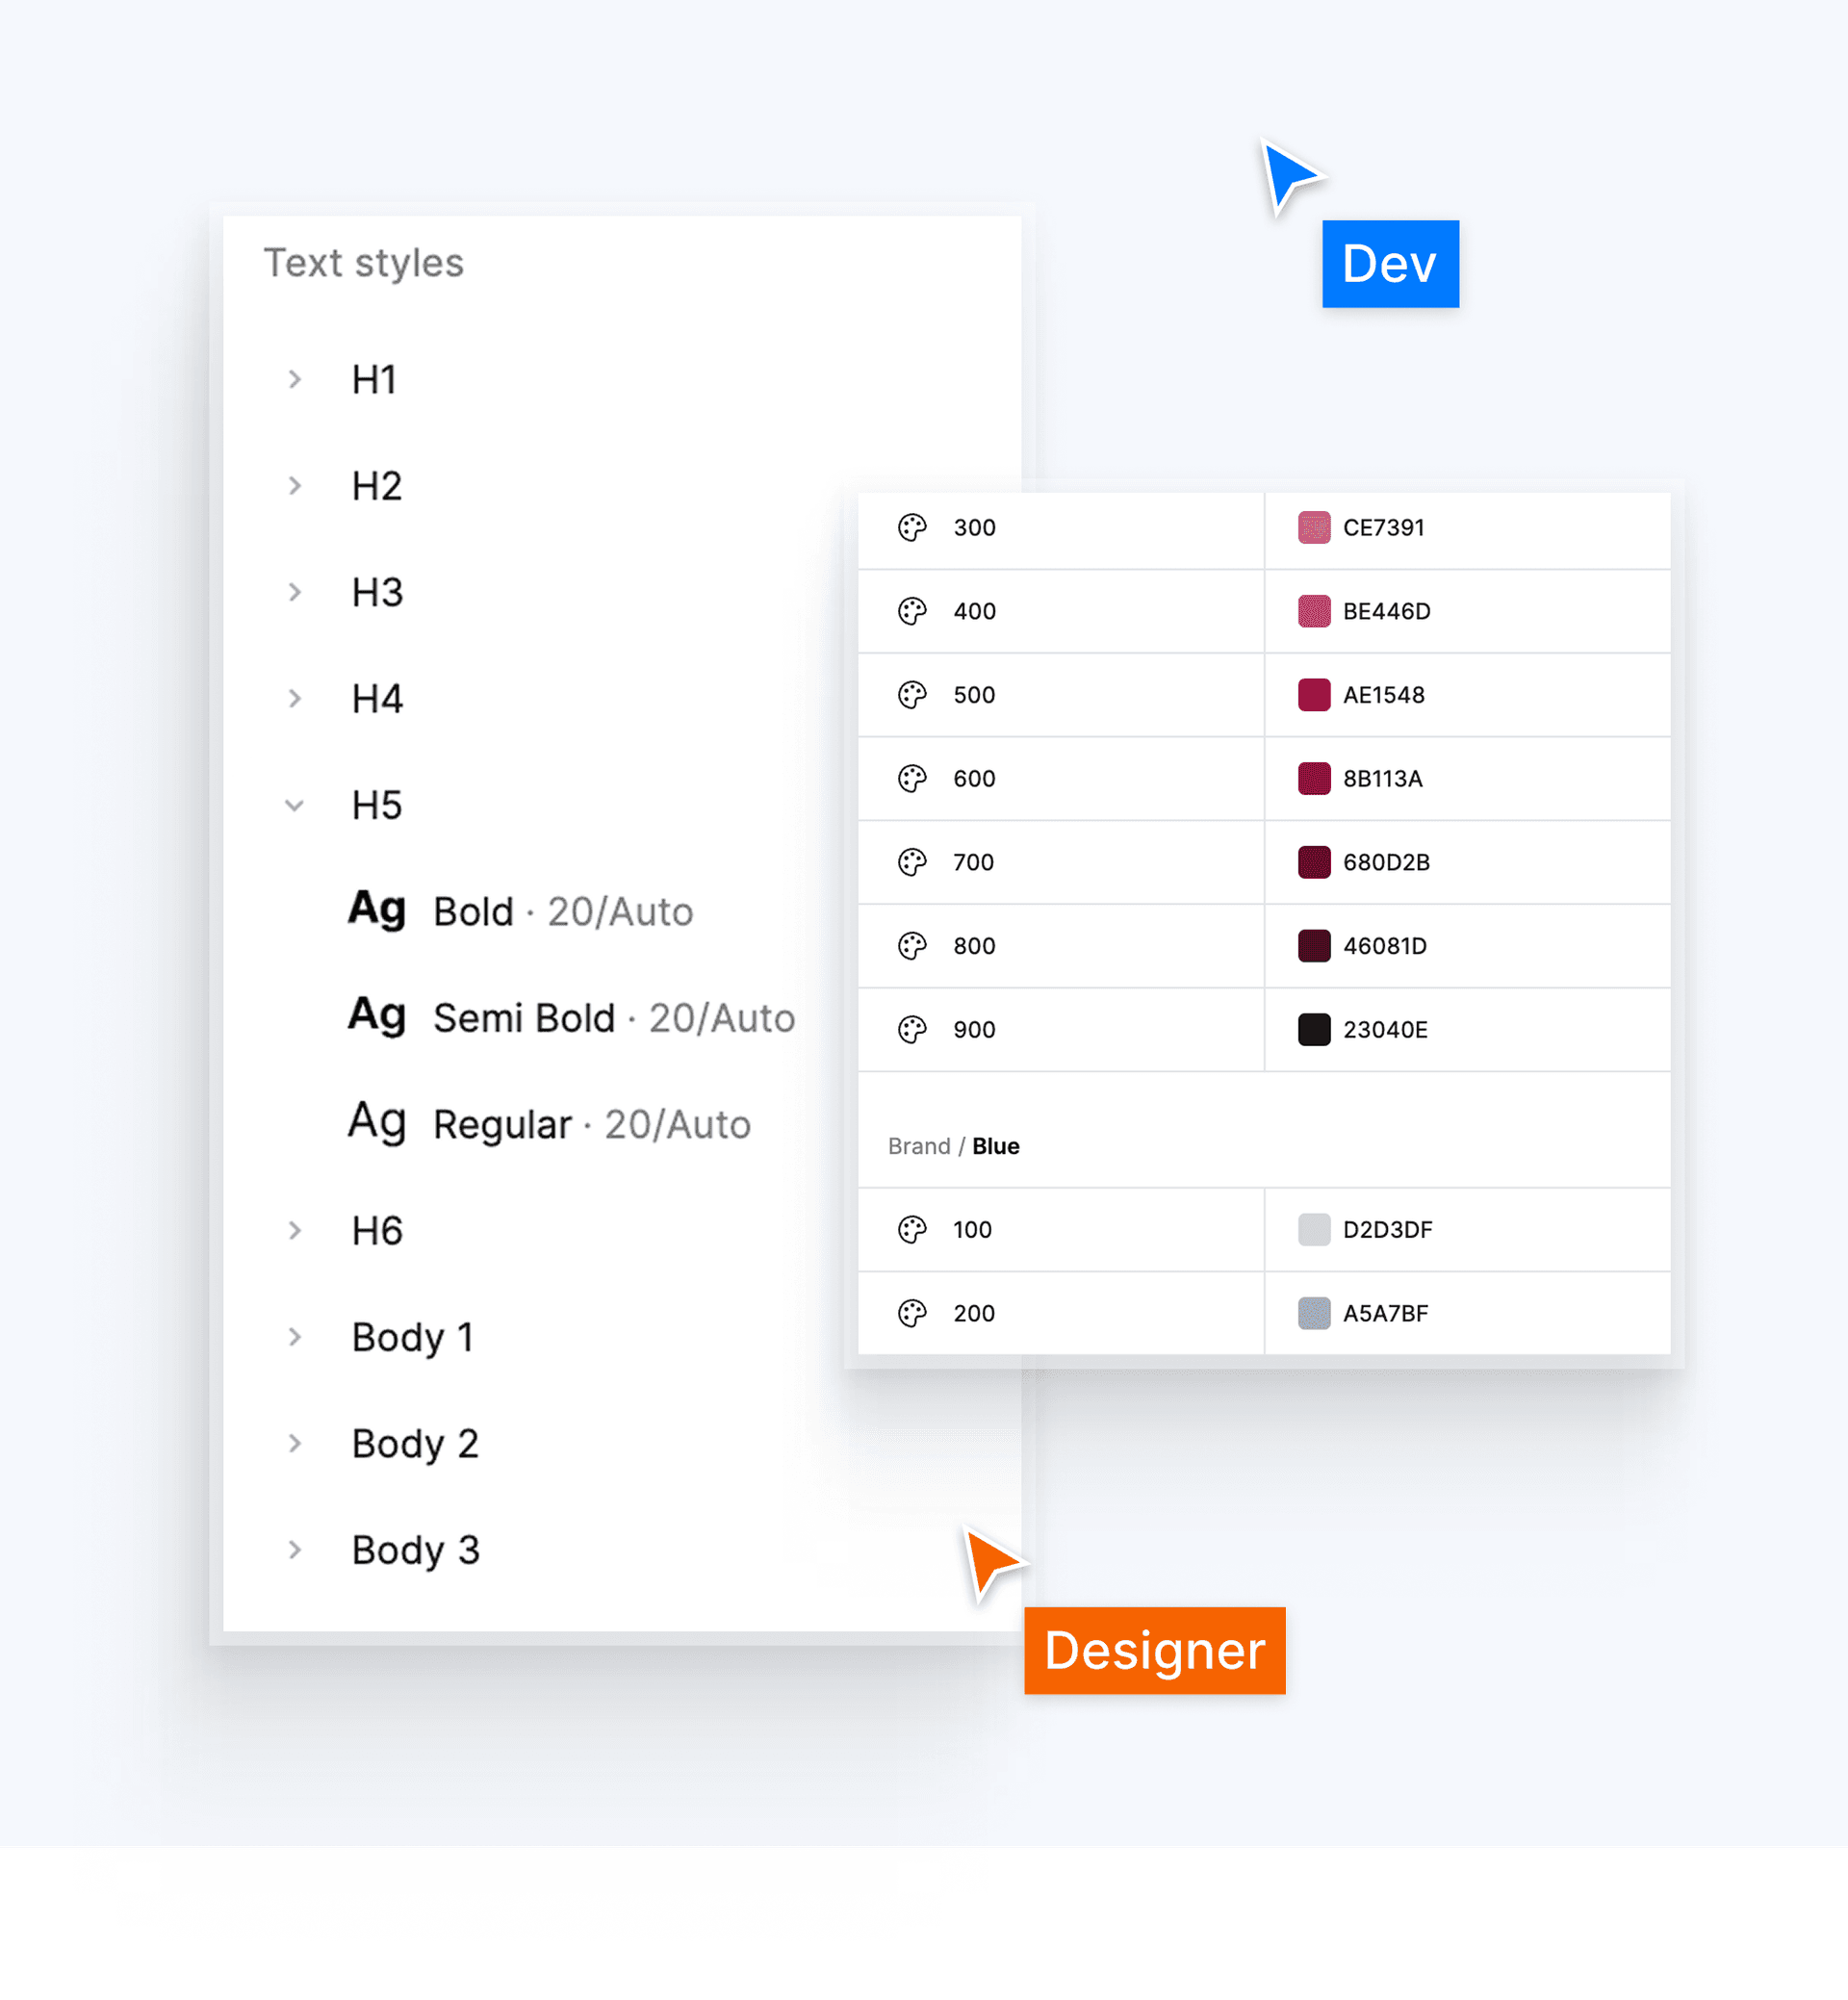
Adapt dashboards to your brand using variables, color systems, typography scales, spacing tokens, and theme controls.
Compare both themes side-by-side and drag the slider to explore how dashboards adapt across different viewing experiences.

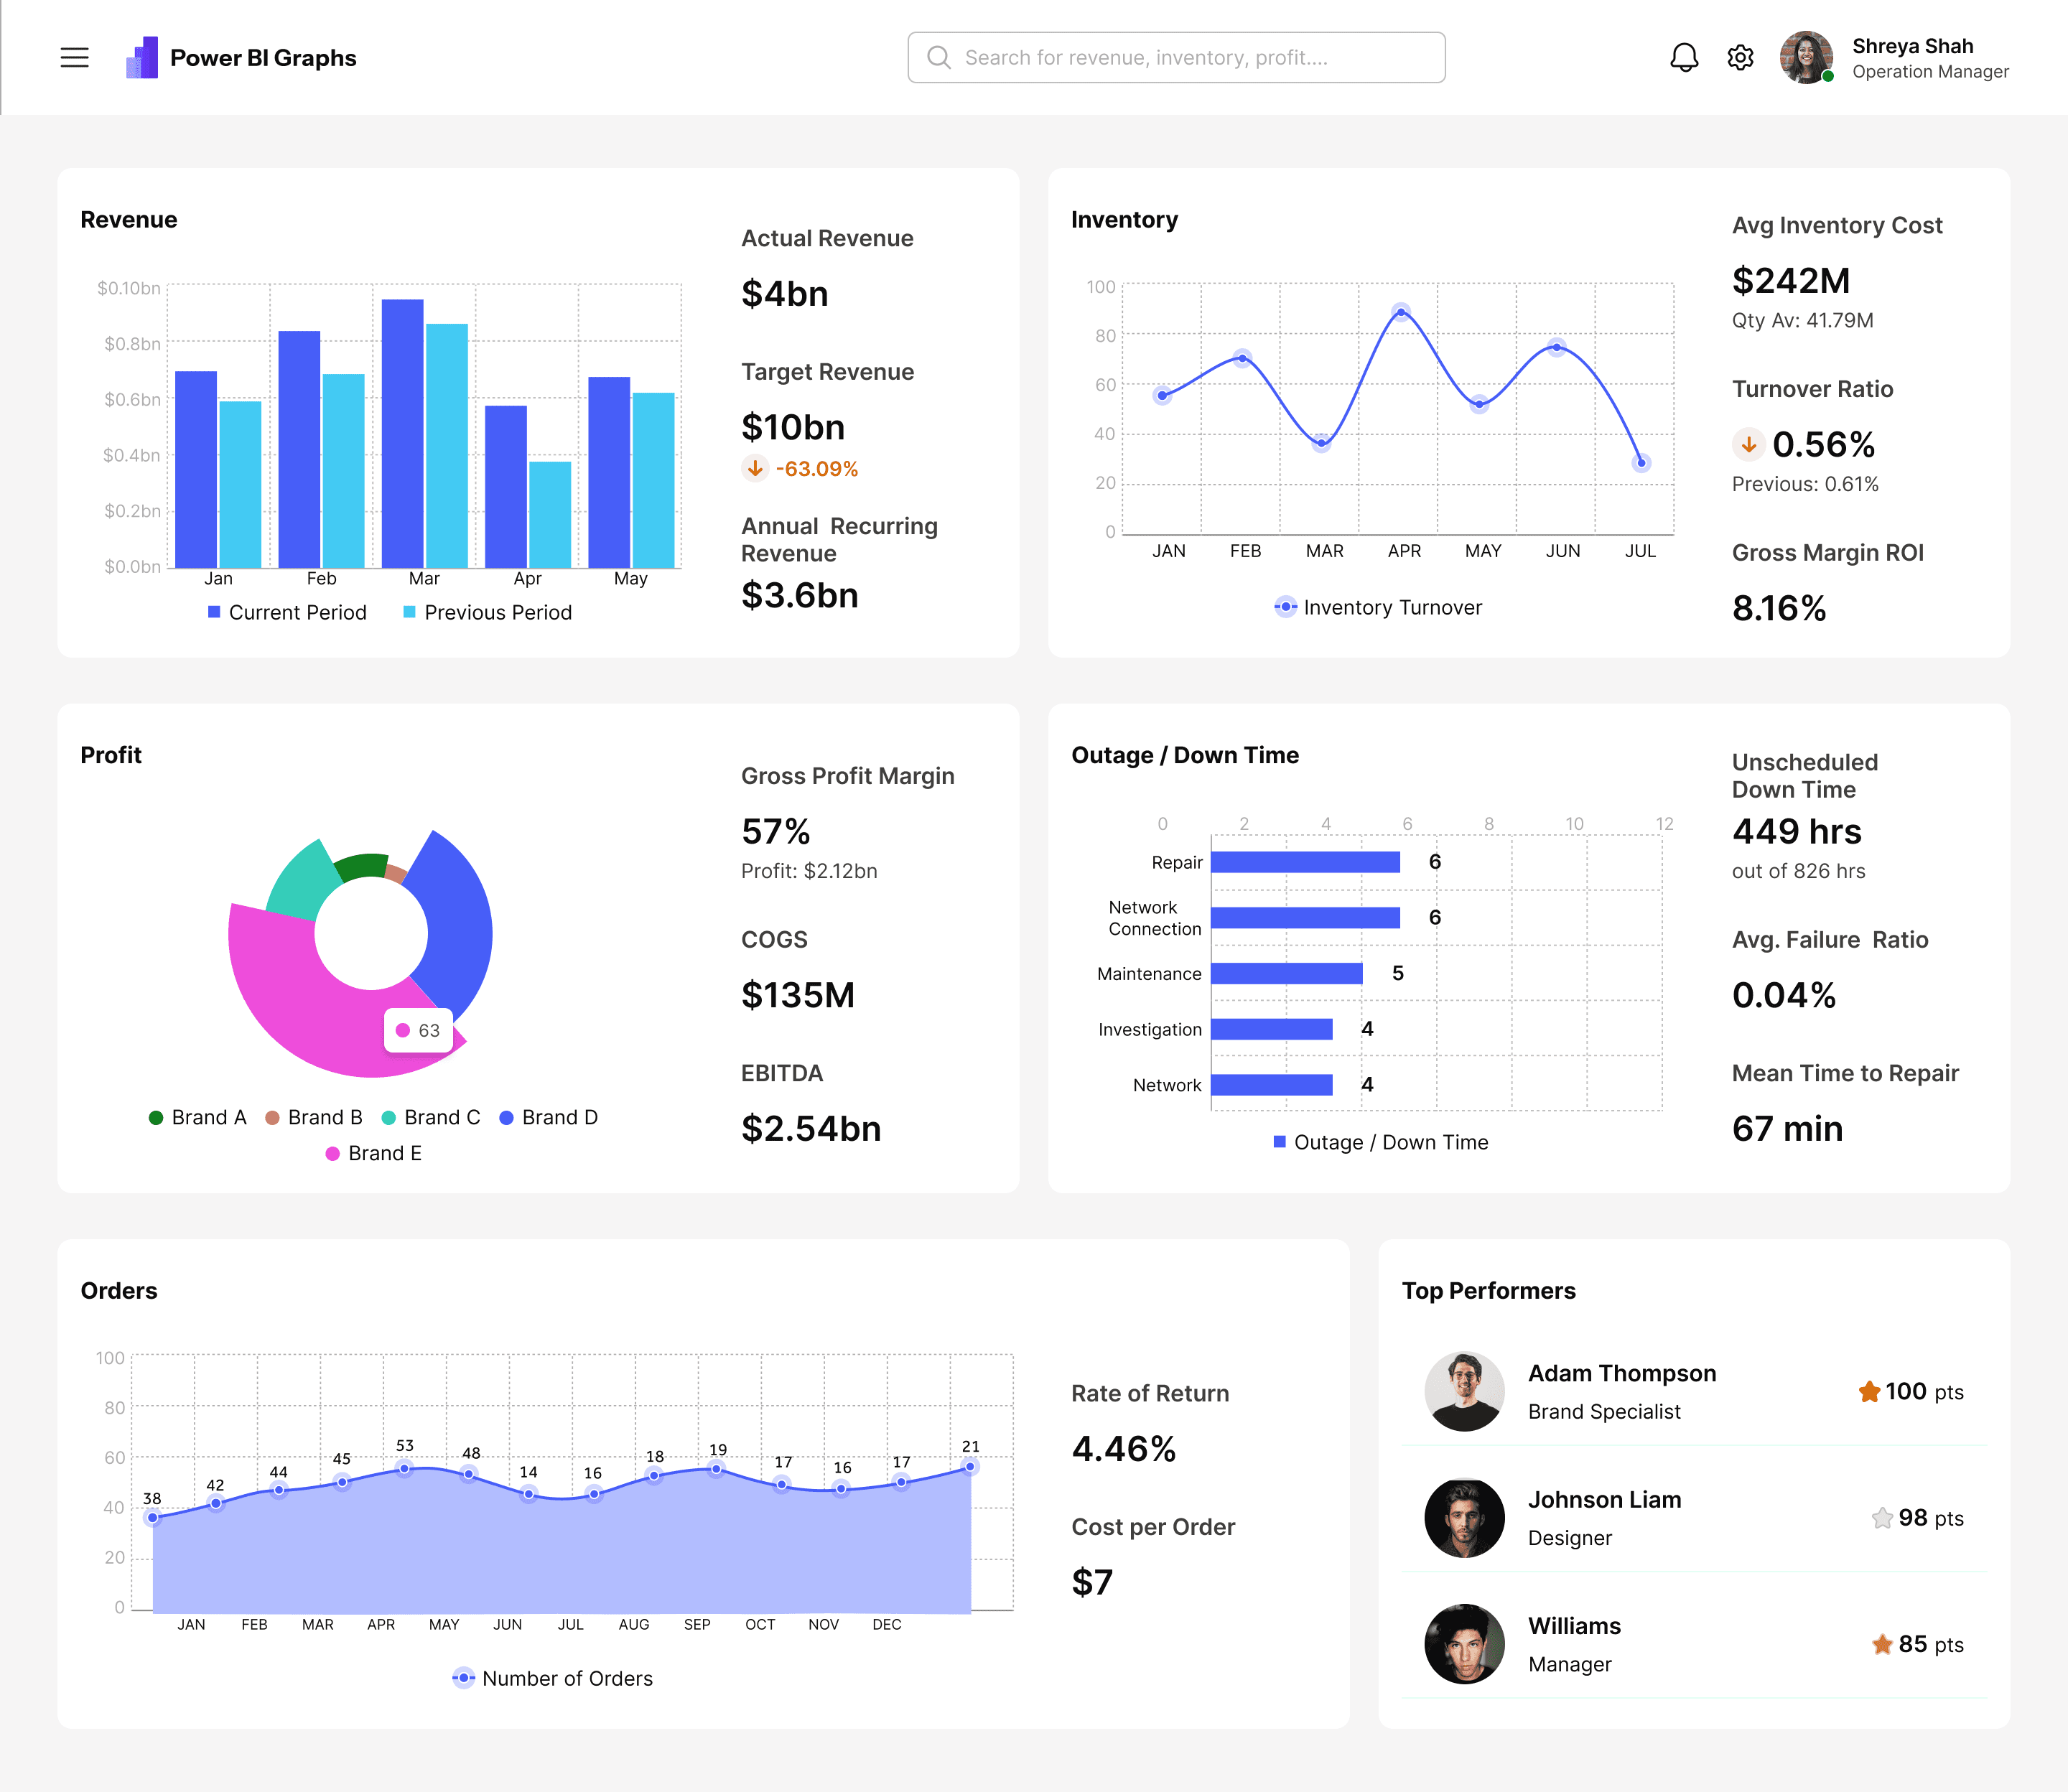
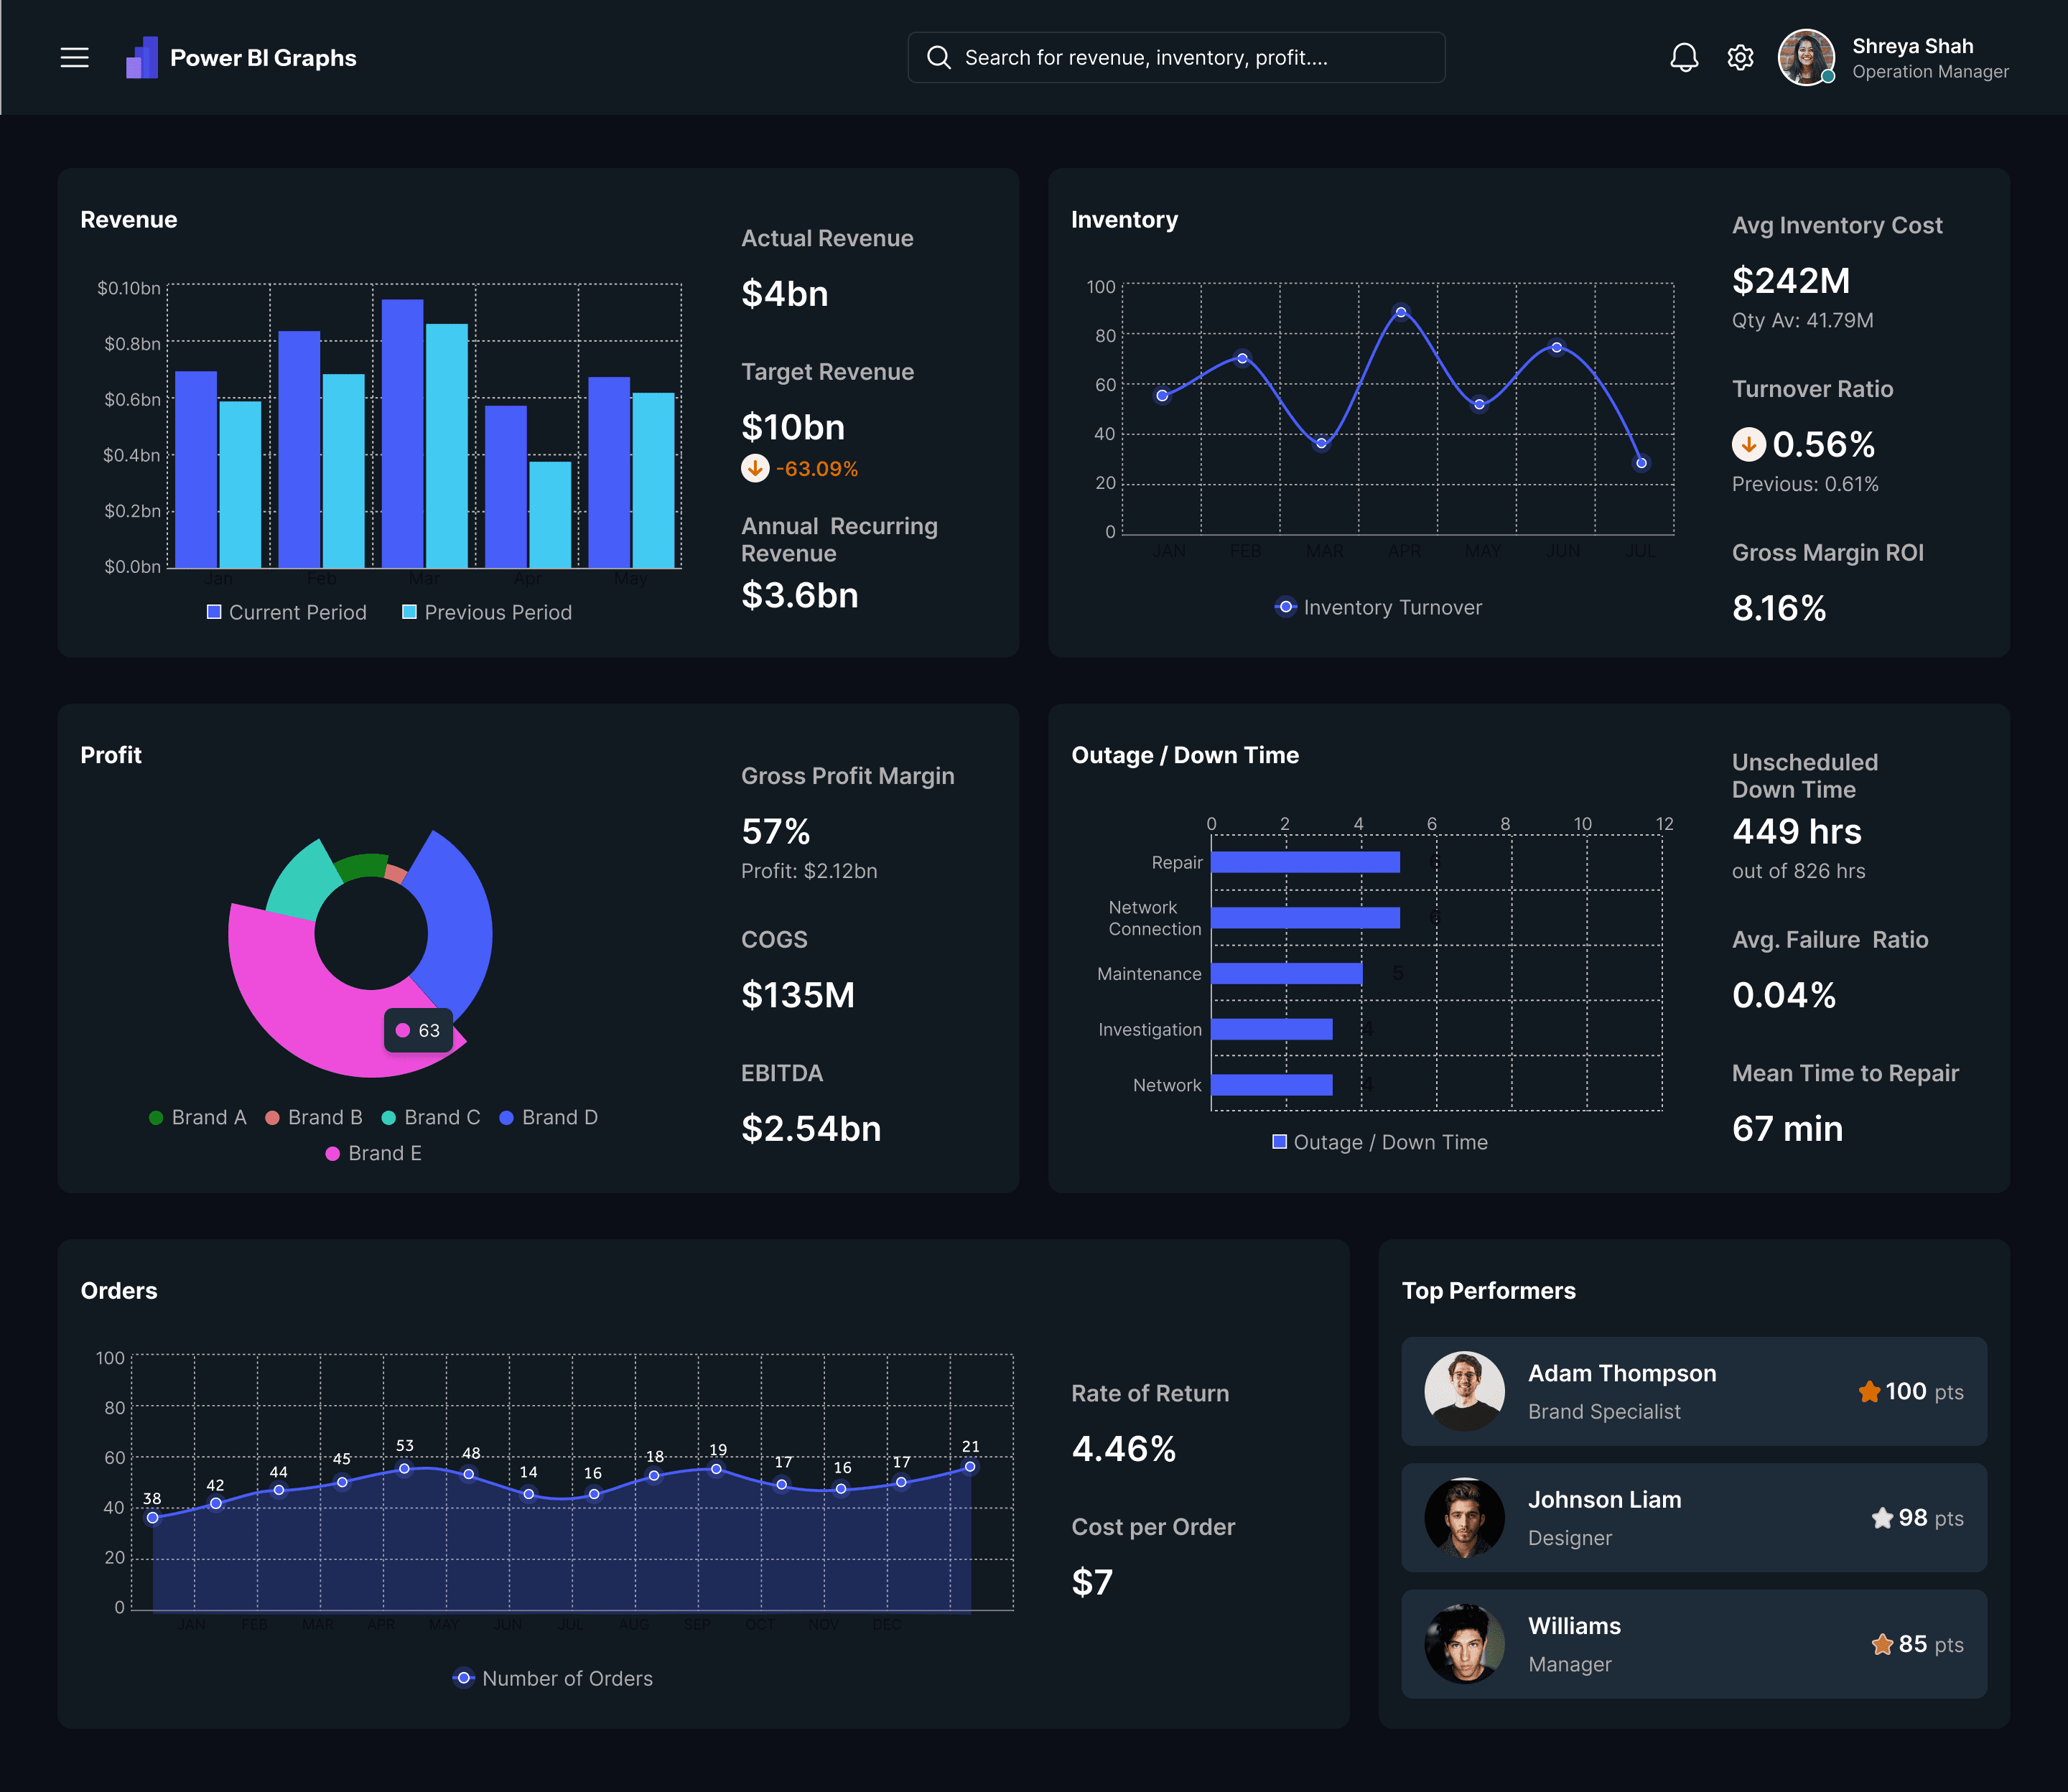
Designed specifically for Power BI dashboard design workflows and modern analytics applications.

Designed specifically for Power BI dashboard workflows.

Reduce design time with reusable dashboard patterns.

Desktop, tablet, and mobile experiences included.

Scalable variables and theme systems built in.

Optimized for design-to-development workflows.

Suitable for agencies, consultants, and enterprise teams.
$199 for the Figma UI Kit. Nudge BI’s solo kit is $249. Matching PBIX files are optional — five industries for $99, or $29 each.
Choosing between kits? See all comparisons or PowerBIGraphs vs Nudge BI.
We tried to address the most common questions related to the Power BI UI Kit. If you have additional questions, please don't hesitate to contact our team.
The Power BI Figma UI Kit includes 7,800+ dashboard components and variants, KPI cards, charts, tables, filters, navigation elements, responsive layouts, design tokens, variables, light and dark themes, and mobile dashboard designs. Everything is organized for rapid dashboard design and efficient developer handoff.
Get a sample file by email, then preview the full kit in Figma.